Category Archives: Detroit

Near-Poisson statistics: how many police – firemen for a small city?

In a previous post, I dealt with the nearly-normal statistics of common things, like river crests, and explained why 100 year floods come more often than once every hundred years. As is not uncommon, the data was sort-of like a normal distribution, but deviated at the tail (the fantastic tail of the abnormal distribution). But now I’d like to present my take on a sort of statistics that (I think) should be used for the common problem of uncommon events: car crashes, fires, epidemics, wars…

Normally the mathematics used for these processes is Poisson statistics, and occasionally exponential statistics. I think these approaches lead to incorrect conclusions when applied to real-world cases of interest, e.g. choosing the size of a police force or fire department of a small town that rarely sees any crime or fire. This is relevant to Oak Park Michigan (where I live). I’ll show you how it’s treated by Poisson, and will then suggest a simpler way that’s more relevant.

First, consider an idealized version of Oak Park, Michigan (a semi-true version until the 1980s): the town had a small police department and a small fire department that saw only occasional crimes or fires, all of which required only 2 or 4 people respectively. Lets imagine that the likelihood of having one small fire at a given time is x = 5%, and that of having a violent crime is y =5% (it was 6% in 2011). A police department will need to have to have 2 policemen on call at all times, but will want 4 on the 0.25% chance that there are two simultaneous crimes (.05 x .05 = .0025); the fire department will want 8 souls on call at all times for the same reason. Either department will use the other 95% of their officers dealing with training, paperwork, investigations of less-immediate cases, care of equipment, and visiting schools, but this number on call is needed for immediate response. As there are 8760 hours per year and the police and fire workers only work 2000 hours, you’ll need at least 4.4 times this many officers. We’ll add some more for administration and sick-day relief, and predict a total staff of 20 police and 40 firemen. This is, more or less, what it was in the 1980s.

If each fire or violent crime took 3 hours (1/8 of a day), you’ll find that the entire on-call staff was busy 7.3 times per year (8x365x.0025 = 7.3), or a bit more since there is likely a seasonal effect, and since fires and violent crimes don’t fall into neat time slots. Having 3 fires or violent crimes simultaneously was very rare — and for those rare times, you could call on nearby communities, or do triage.

In response to austerity (towns always overspend in the good times, and come up short later), Oak Park realized it could use fewer employees if they combined the police and fire departments into an entity renamed “Public safety.” With 45-55 employees assigned to combined police / fire duty they’d still be able to handle the few violent crimes and fires. The sum of these events occurs 10% of the time, and we can apply the sort of statistics above to suggest that about 91% of the time there will be neither a fire nor violent crime; about 9% of the time there will be one or more fires or violent crimes (there is a 5% chance for each, but also a chance that 2 happen simultaneously). At least two events will occur 0.9% of the time (2 fires, 2 crimes or one of each), and they will have 3 or more events .09% of the time, or twice per year. The combined force allowed fewer responders since it was only rarely that 4 events happened simultaneously, and some of those were 4 crimes or 3 crimes and a fire — events that needed fewer responders. Your only real worry was when you have 3 fires, something that should happen every 3 years, or so, an acceptable risk at the time.

Before going to what caused this model of police and fire service to break down as Oak Park got bigger, I should explain Poisson statistics, exponential Statistics, and Power Law/ Fractal Statistics. The only type of statistics taught for dealing with crime like this is Poisson statistics, a type that works well when the events happen so suddenly and pass so briefly that we can claim to be interested in only how often we will see multiples of them in a period of time. The Poisson distribution formula is, P = rke/r! where P is the Probability of having some number of events, r is the total number of events divided by the total number of periods, and k is the number of events we are interested in.

Using the data above for a period-time of 3 hours, we can say that r= .1, and the likelihood of zero, one, or two events begin in the 3 hour period is 90.4%, 9.04% and 0.45%. These numbers are reasonable in terms of when events happen, but they are irrelevant to the problem anyone is really interested in: what resources are needed to come to the aid of the victims. That’s the problem with Poisson statistics: it treats something that no one cares about (when the thing start), and under-predicts the important things, like how often you’ll have multiple events in-progress. For 4 events, Poisson statistics predicts it happens only .00037% of the time — true enough, but irrelevant in terms of how often multiple teams are needed out on the job. We need four teams no matter if the 4 events began in a single 3 hour period or in close succession in two adjoining periods. The events take time to deal with, and the time overlaps.

The way I’d dealt with these events, above, suggests a power law approach. In this case, each likelihood was 1/10 the previous, and the probability P = .9 x10-k . This is called power law statistics. I’ve never seen it taught, though it appears very briefly in Wikipedia. Those who like math can re-write the above relation as log10P = log10 .9 -k.

One can generalize the above so that, for example, the decay rate can be 1/8 and not 1/10 (that is the chance of having k+1 events is 1/8 that of having k events). In this case, we could say that P = 7/8 x 8-k , or more generally that log10P = log10 A –kβ. Here k is the number of teams required at any time, β is a free variable, and Α = 1-10 because the sum of all probabilities has to equal 100%.

In college math, when behaviors like this appear, they are incorrectly translated into differential form to create “exponential statistics.” One begins by saying ∂P/∂k = -βP, where β = .9 as before, or remains some free-floating term. Everything looks fine until we integrate and set the total to 100%. We find that P = 1/λ e-kλ for k ≥ 0. This looks the same as before except that the pre-exponential always comes out wrong. In the above, the chance of having 0 events turns out to be 111%. Exponential statistics has the advantage (or disadvantage) that we find a non-zero possibility of having 1/100 of a fire, or 3.14159 crimes at a given time. We assign excessive likelihoods for fractional events and end up predicting artificially low likelihoods for the discrete events we are interested in except going away from a calculus that assumes continuity in a world where there is none. Discrete math is better than calculus here.

I now wish to generalize the power law statistics, to something similar but more robust. I’ll call my development fractal statistics (there’s already a section called fractal statistics on Wikipedia, but it’s really power-law statistics; mine will be different). Fractals were championed by Benoit B. Mandelbrot (who’s middle initial, according to the old joke, stood for Benoit B. Mandelbrot). Many random processes look fractal, e.g. the stock market. Before going here, I’d like to recall that the motivation for all this is figuring out how many people to hire for a police /fire force; we are not interested in any other irrelevant factoid, like how many calls of a certain type come in during a period of time.

To choose the size of the force, lets estimate how many times per year some number of people are needed simultaneously now that the city has bigger buildings and is seeing a few larger fires, and crimes. Lets assume that the larger fires and crimes occur only .05% of the time but might require 15 officers or more. Being prepared for even one event of this size will require expanding the force to about 80 men; 50% more than we have today, but we find that this expansion isn’t enough to cover the 0.0025% of the time when we will have two such major events simultaneously. That would require a 160 man fire-squad, and we still could not deal with two major fires and a simultaneous assault, or with a strike, or a lot of people who take sick at the same time. 

To treat this situation mathematically, we’ll say that the number times per year where a certain number of people are need, relates to the number of people based on a simple modification of the power law statistics. Thus:  log10N = A – βθ  where A and β are constants, N is the number of times per year that some number of officers are needed, and θ is the number of officers needed. To solve for the constants, plot the experimental values on a semi-log scale, and find the best straight line: -β is the slope and A  is the intercept. If the line is really straight, you are now done, and I would say that the fractal order is 1. But from the above discussion, I don’t expect this line to be straight. Rather I expect it to curve upward at high θ: there will be a tail where you require a higher number of officers. One might be tempted to modify the above by adding a term like but this will cause problems at very high θ. Thus, I’d suggest a fractal fix.

My fractal modification of the equation above is the following: log10N = A-βθ-w where A and β are similar to the power law coefficients and w is the fractal order of the decay, a coefficient that I expect to be slightly less than 1. To solve for the coefficients, pick a value of w, and find the best fits for A and β as before. The right value of w is the one that results in the straightest line fit. The equation above does not look like anything I’ve seen quite, or anything like the one shown in Wikipedia under the heading of fractal statistics, but I believe it to be correct — or at least useful.

To treat this politically is more difficult than treating it mathematically. I suspect we will have to combine our police and fire department with those of surrounding towns, and this will likely require our city to revert to a pure police department and a pure fire department. We can’t expect other cities specialists to work with our generalists particularly well. It may also mean payments to other cities, plus (perhaps) standardizing salaries and staffing. This should save money for Oak Park and should provide better service as specialists tend to do their jobs better than generalists (they also tend to be safer). But the change goes against the desire (need) of our local politicians to hand out favors of money and jobs to their friends. Keeping a non-specialized force costs lives as well as money but that doesn’t mean we’re likely to change soon.

Robert E. Buxbaum  December 6, 2013. My two previous posts are on how to climb a ladder safely, and on the relationship between mustaches in WWII: mustache men do things, and those with similar mustache styles get along best.

Improving Bankrupt Detroit

Detroit is Bankrupt in more ways than one. Besides having too few assets to cover their $18 Billion in debts, and besides running operational deficits for years, Detroit is bankrupt in the sense that most everyone who can afford to leaves. The population has shrunk from 2,000,000 in 1950 to about 680,000 today, an exodus that shows no sign of slowing.

The murder rate in Detroit is 25 times the state average; 400/year in 2012 (58/100,00) as compared to 250 in the rest of the state (2.3/100,000). The school system in 2009 scored the lowest math scores that had ever been recorded for any major city in the 21 year history of the tests. And mayor Kwame Kilpatrick, currently in prison, was called “a walking crime wave” by the mayor of Washington DC. The situation is not pretty. Here are a few simple thoughts though.

(1) Reorganize the city to make it smaller. The population density of Detroit is small, generally about 7000/ square mile, and some of the outlying districts might be carved off and made into townships. Most of Michigan started as townships. When they return to that status, each could contract their children’s education as they saw fit, perhaps agreeing to let the outlying cities use their school buildings and teachers, or perhaps closing failed schools as the local area sees fit.

This could work work well for outlying areas like the southern peninsula of Detroit, Mexicantown and south, a narrow strip of land lying along Route 75 that’s further from the center of Detroit than it is from the centers of 5 surrounding cities: River Rouge, Ecorse, Dearborn, Melvindale, and Lincoln Park. This area was Stillwell township before being added to Detroit in 1922. If removed from Detroit control the property values would likely rise. The people could easily contract education or police with any of the 5 surrounding cities that were previously parts of Stillwell township. Alternately, this newly created township might easily elect to join one of the surrounding communities entirely. All the surrounding communities offer lower crime and better services than Detroit. Most manage to do it with lower tax rates too.

Another community worth removing from Detroit is the western suburb previously known as Greenfield, This community was absorbed into Detroit in 1925. Like the Mexicantown area, this part of Detroit still has a majority of the houses occupied, and the majority of the businesses are viable enough that the area could reasonably stand on its own. Operating as a township, they could bring back whatever services they consider more suitable to their population. They would be in control of their own destiny.


Murder rate in Finland, Japan higher than in US

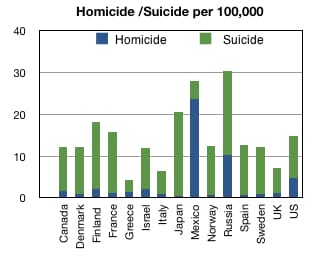
The murder rate in Finland and Japan is higher than in the US if suicide is considered as a type of murder. In the figure below, I’ve plotted total murder rates (homicide plus suicide) for several developed-world countries. The homicide component is in blue, with the suicide rate above it, in green. In terms of this total, the US is seen to be about average among the developed counties. Mexico has the highest homicide rate for those shown, Japan has the highest suicide rate, and Russia has this highest total murder rate shown (homicide + suicide): nearly double that of the US and Canada. In Russia and Japan, some .02% of the population commit suicide every year. The Scandinavian countries are quite similar to the US, and Japan, and Mexico are far worse. Italy, Greece and the UK are better than the US, both in terms of low suicide rate and low homicide rate.

  Combined homicide and suicide rates for selected countries, 2005.


Homicide and suicide rates for selected countries, 2005 Source: Wikipedia.

In the US, pundants like Piers Morgan like to use our high murder rate as an indicator of the ills of American society: loose gun laws are to blame, they say, along with the lack of social welfare safety net, a lack of support for the arts, and a lack of education and civility in general. Japan, Canada, and Scandinavia are presented as near idyls, in these regards. When murder is considered to include suicide though, the murder-rate difference disappears. Add to this, that violent crime rates are higher in Europe, Canada, and the UK, suggesting that clean streets and education do not deter crime.

The interesting thing though is suicide, and what it suggests about happiness. According to my graphic, the happiest, safest countries appear to be Italy and Greece. Part of this is likely weather , people commit suicide more in cold countries, but another part may be that some people (malcontents?) are better served by dirty, noisy cafés and pubs where people meet and complain, and are not so well served by clean streets and civility. It’s bad enough to be a depressed outsider, but it’s really miserable if everything around you is clean, and everyone is polite but busy.

Yet another thought about the lower suicide rates in the US and Mexico, is that some of the homicide in these countries is really suicide by proxy. In the US and Mexico depressed people (particularly men) can go off to war or join gangs. They still die, but they die more heroically (they think) by homicide. They volunteer for dangerous army missions or to attack a rival drug-lord outside a bar. Either they succeed in killing someone else, or they’re shot dead. If you’re really suicidal and can’t join the army, you could move to Detroit; the average house sold for $7100 last year (it’s higher now, I think), and the homicide rate was over 56 per 100,000. As bad as that sounds, it’s half the murder rate of Greenland, assuming you take suicide to be murder.

R.E. Buxbaum, Sept 14, 2013

Detroit Teachers are not paid too much

Detroit is bankrupt financially, but not because the public education teachers have negotiated rich contracts. If anything Detroit teachers are paid too little given the hardship of their work. The education problem in Detroit, I think, is with the quality of education, and of life. Parents leave Detroit, if they can afford it; students who can’t leave the city avoid the Detroit system by transferring to private schools, by commuting to schools in the suburbs, or by staying home. Fewer than half of Detroit students are in the Detroit public schools.

The average salary for a public school teacher in Detroit is (2013) $51,000 per year. That’s 3% less than the national average and $3,020/year less than the Michigan average. While some Detroit teachers are paid over $100,000 per year, a factoid that angers some on the right, that’s a minority of teachers, only those with advanced degrees and many years of seniority. For every one of these, the Detroit system has several assistant teachers, substitute teachers, and early childhood teachers earning $20,000 to $25,000/ year. That’s an awfully low salary given their education and the danger and difficulty of their work. It’s less than janitors are paid on an annual basis (janitors work more hours generally). This is a city with 25 times the murder rate in the rest of the state. If anything, good teachers deserve a higher salary.

Detroit public schools provide among the worst math education in the US. In 2009, showing the lowest math proficiency scores ever recorded in the 21-year history of the national math proficiency test. Attendance and graduation are low too: Friday attendance averages 71.2%, and is never as high as 80% on any day. The high-school graduation rate in Detroit is only 29.4%. Interested parents have responded by shifting their children out of the Detroit system at the rate of 8000/year. Currently, less than half of school age children go to Detroit public schools (51,070 last year); 50,076 go to charter schools, some 9,500 go to schools in the suburbs, and 8,783, those in the 5% in worst-performing schools, are now educated by the state reform district.

Outside a state run reform district school, The state has taken over the 5% worst performing schools.

The state of Michigan has taken over the 5% worst performing schools in Detroit through their “Reform District” system. They provide supplies and emphasize job-skills.

Poor attendance and the departure of interested students makes it hard for any teacher to handle a class. Teachers must try to teach responsibility to kids who don’t show up, in a high crime setting, with only a crooked city council to look up to. This is a city council that oversaw decades of “pay for play,” where you had to bribe the elected officials to bid on projects. Even among officials who don’t directly steal, there is a pattern of giving themselves and their families fancy cars or gambling trips to Canada using taxpayers dollars. The mayor awarded Cadillac Escaldes to his family and friends, and had a 22-man team of police to protect him. On this environment, a teacher has to be a real hero to achieve even modest results.

Student departure means there a surfeit of teachers and schools, but it is hard to see what to do. You’d like to reassign teachers who are on the payroll, but doing little, and fire the worst teachers. Sorry to say, it’s hard to fire anyone, and it’s hard to figure out which are the bad teachers; just because your class can’t read doesn’t mean you are a bad teacher. Recently a teacher of the year was fired because the evaluation formula gave her a low rating.

Making changes involves upending union seniority rules. Further, there is an Americans with Disability Act that protects older teachers, along with the lazy, the thief, and the drug addict — assuming they claim disability by frailty, poor upbringing or mental disease. To speed change along, I would like to see the elected education board replaced by an appointed board with the power to act quickly and the responsibility to deliver quality education within the current budget. Unlike the present system, there must be oversight to keep them from using the money on themselves.

She state could take over more schools into the reform school district, or they could remove entire school districts from Detroit incorporation and make them Michigan townships. A Michigan township has more flexibility in how they run schools, police, and other services. They can run as many schools as they want, and can contract with their neighbors or independent suppliers for the rest. A city has to provide schools for everyone who’s not opted out. Detroit’s population density already matches that of rural areas; rural management might benefit some communities.

I would like to see the curriculum modified to be more financially relevant. Detroit schools could reinstate classes in shop and trade-skills. In effect that’s what’s done at Detroit’s magnet schools, e.g. the Cass Academy and the Edison Academy. It’s also the heart of several charter schools in the state-run reform district. Shop class teaches math, an important basis of science, and responsibility. If your project looks worse than your neighbor’s, you can only blame yourself, not the system. And if you take home your work, there is that reward for doing a good job. As a very last thought, I’d like to see teachers paid more than janitors; this means that the current wage structure has to change. If nothing else, a change would show that there is a monetary value in education.

Robert Buxbaum, August 16, 2013; I live outside Detroit, in one of the school districts that students go to when they flee the city.

Surrealists art joke

How many surrealists does it take to screw in a lightbulb.

The fish.

Surrealism aims to show the reality that exceeds realism; the dream-like absurd that is beyond the rational, common-sensical and practical. Beyond control engineering.

And you know “How many engineers would it take to screw in a lightbulb?” —- “Minimally two, and it would have to be a very large lightbulb.”

Even if the insights of surrealism are common-place, for example, that the eye is a false mirror of the world, I like is that they become real (if the surrealist is talented.)

False Mirror by Magritte; The idea, I suppose is that the eye is a false mirror of the world, seeing what's already within it.

False Mirror by Magritte; the idea, I suppose is that we see what’s already within us.

“The greatest obstacle to discovering the shape of the earth, the continents, and the oceans was not ignorance but the illusion of knowledge.” What I particularly like is the falseness of the mirror is shown as both false and true. The world is rarely this or that. Another insight / joke.

We all have masks, especially with those we love.

We all have masks, especially with those we love.

I imagine most I could make second-rate surrealistic works. The way to know your work is second rate it’s beautiful and insightful, but not funny.

Creation of Man-the-militant in the style of Michelangelo

Creation of Man-the-militant. Kuksi. It’s well done, and interesting (a retake on Michelangelo), but it’s not funny. See my cartoon in mechanical v civil engineers joke.

And then there is bad modern art. You could argue that this isn’t surreal, but some sort of other modern art, or post modern art. But that’s all false: it’s just bad art.

Bad modern art: little skill, little meaning, no humor. If you have to ask: "is it art?" It usually isn't.

Bad modern art: little skill, little meaning, no humor. If you have to ask: “is it art?” It usually isn’t.

If you buy something like this, and put it in your corporate headquarters lobby, the joke’s on you, and the artist is laughing his or her way to the bank.  Here is a link to why surrealism should be funny, And why architecture should not be (someone’s got to live in that joke).

R. E. Buxbaum, August 5, 2013

Simple electroplating of noble metals

Electro-coating gold onto a Pd tube by dissolving an iron wire.

Electro-coating gold onto at Pd-coated tube by dissolving an iron wire at REB Research.

Here’s a simple trick for electroplating noble metals: gold, silver, copper, platinum. I learned this trick at Brooklyn Technical High School some years ago, and I still use it at REB Research as part of our process to make hydrogen permeation barriers, and sulfur tolerant permeation membranes.  It’s best used to coat reasonably inactive, small objects,  e.g. to coat copper on a nickel or silver on a penny for a science fair.

As a first step, you make a dilute acidic solution of the desired noble metal. Dissolve a gram or so of copper sulphate, silver nitrate, or gold chloride per 250 ml of water. Make sure the solution is acidic using pH paper, add acid if needed aiming for a pH of 3 to 4. Place some solution into a test tube or beaker of a size that will hold the object you want to coat. As a next step, attach an iron or steel wire to the object, I typically use bailing wire from the hardware store wrapped several times about the top of the object, and run the length of the object; see figure. Place the object into your solution and wait for 5 to 30 minutes. Coating works without the need for any other electric source or any current control.

The iron wire creates the electricity used in electroplating the noble metal. Iron has a higher electro-motive potential than hydrogen and hydrogen has a higher potential than the noble metals. In acid solution, the iron wire dissolves but (it’s hoped) the substrate does not. Each iron atom gives up two electrons, becoming Fe++. Some of these electrons go on to reduce hydrogen ions making H2 (2H+ 2e –> H2), but most should go to reduce the noble metal ions in the solution to form a coat of metallic gold, silver, or copper on both the wire and the object. See an example of how I do calculations regarding voltage, electron number, and Gibbs free energy.

Transferring electrons requires you have good electrical contact between the wire and the object. Most of the noble metal coats the object, not the wire since the object is bigger, typically. Thanks to my teachers at Brooklyn Technical High School for teaching me. For a uniform coat, it helps to run the wire down parallel to the entire length of tube; I think this is a capacitance, field effect. For a larger object, you may want several wires if you are plating a larger object. For a thicker coat, I found you are best off making many thin coats and heating them. This reduces tension forces in the coat, I think.

The picture shows a step in the process we use making our sulfur-resistant hydrogen permeation membranes (buy them here), used, e.g. to concentrate impurities in a hydrogen stream for improved gas chromatography. The next step is to dissolve the gold or copper into the palladium.

Go here for a great periodic table cup from REB Research, or for the rest of our REB Research products. I occasionally make silver-coated pennies for schoolchildren, but otherwise use this technology only for in-house production.

R.E. Buxbaum, July 20, 2013.

Crime: US vs UK and Canada

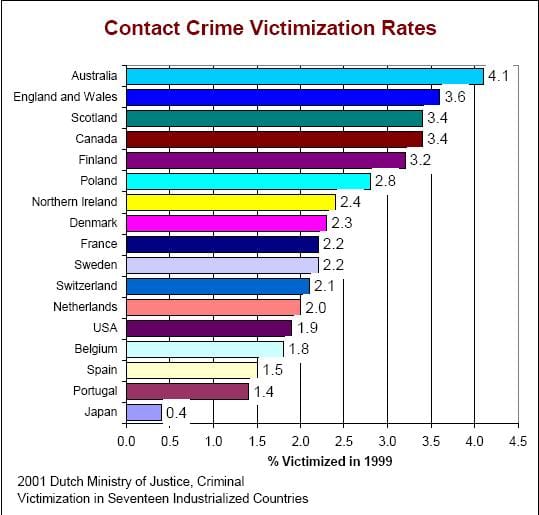
The US has a lot of guns and a lot of murders compared to England, Canada, and most of Europe. This is something Piers Morgan likes to point out to Americans who then struggle to defend the wisdom of gun ownership and the 2nd Amendment: “How do you justify 4.8 murders/year per 100,000 population when there are only 1.6/year per 100,000 in Canada, 1.2/year per 100,000 in the UK, and 1.0/year per 100,000 in Australia — countries with few murders and tough anti-gun laws?,” he asks. What Piers doesn’t mention, is that these anti-gun countries have far higher contact crime (assault) rates than the US, see below.

Contact Crime Per Country

Contact crime rates for 17 industrialized countries. From the Dutch Ministry of Justice. click here for details about the survey and a breakdown of crimes.

The differences narrow somewhat when considering most violent crimes, but we still have far fewer than Canada and the UK. Canada has 963/year per 100,000 “most violent crimes,” while the US has 420/year per 100,000. “Most violent crimes” here are counted as: “murder and non-negligent manslaughter,” “forcible rape,” “robbery,” and “aggravated assault” (FBI values). England and Wales classify crimes somewhat differently, but have about two times the US rate, 775/year per 100,000, if “most violent crimes” are defined as: “violence against the person, with injury,” “most serious sexual crime,” and “robbery.”

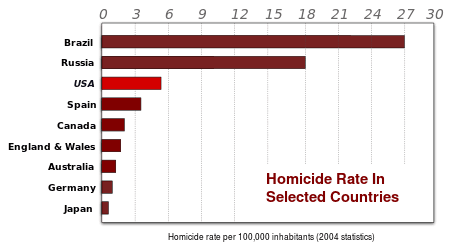
It is possible that the presence of guns protects Americans from general crime while making murder more common, but it’s also possible that gun ownership is a murder deterrent too. Our murder rate is 1/5 that of Mexico, 1/4 that of Brazil, and 1/3 that of Russia; all countries with strong anti-gun laws but a violent populous. Perhaps the US (Texan) penchant for guns is what keeps Mexican gangs on their, gun-control side of the border. Then again, it’s possible that guns neither increase nor decrease murder rates, so that changing our laws would not have any major effect. Switzerland (a country with famously high gun ownership) has far fewer murders than the US and about 1/2 the rate of the UK: 0.7 murders/ year per 100,000. Japan, a country with low gun ownership has hardly any crime of any sort — not even littering. As in the zen buddhist joke, change comes from within.

Homicide rate per country

Homicide rate per country

One major theory for US violence was that drugs and poverty were the causes. Remove these by stricter anti-drug laws and government welfare, and the violent crime would go away. Sorry to say, it has not happened; worse yet, murder rates are highest in cities like Detroit where welfare is a way of life, and where a fairly high fraction of the population is in prison for drugs.

I suspect that our welfare payments have hurt Detroit as much as they’ve helped, and that Detroit’s higher living wage, has made it hard for people to find honest work. Stiff drug penalties have not helped Detroit either, and may contribute to making crimes more violent. As Thomas More pointed out in the 1500s, if you are going to prison for many years for a small crime, you’re more likely to use force to avoid risk capture. Perhaps penalties would work better if they were smaller.

Charity can help a city, i think, and so can good architecture. I’m on the board of two charities that try to do positive things, and I plant trees in Detroit (sometimes).

R. E. Buxbaum, July 10, 2013. To make money, I sell hydrogen generators: stuff I invented, mostly.

What’s Holding Gilroy on the Roof

We recently put a sculpture on our roof: Gilroy, or “Mr Hydrogen.” It’s a larger version of a creepy face sculpture I’d made some moths ago. Like it, and my saber-toothed tiger, the eyes follow you. A worry about this version: is there enough keeping it from blowing down on the cars? Anyone who puts up a large structure must address this worry, but I’m a professional engineer with a PhD from Princeton, so my answer is a bit different from most.

Gilroy (Mr Hydrogen) sculpture on roof of REB Research & Consulting. The eyes follow you.

Gilroy (Mr Hydrogen) sculpture on roof of REB Research & Consulting. The eyes follow you. Aim is that it should withstand 50 mph winds.

The main force on most any structure is the wind (the pyramids are classic exceptions). Wind force is generally proportional to the exposed area and to the wind-speed squared: something called form-drag or quadratic drag. Since force is related to wind-speed, I start with some good statistics for wind speed, shown in the figure below for Detroit where we are.

The highest Detroit wind speeds are typically only 16 mph, but every few years the winds are seen to reach 23 mph. These are low relative to many locations: Detroit has does not get hurricanes and rarely gets tornadoes. Despite this, I’ve decided to brace the sculpture to withstand winds of 50 mph, or 22.3 m/s. On the unlikely chance there is a tornado, I figure there would be so much other flotsam that I would not have to answer about losing my head. (For why Detroit does not get hurricanes or tornadoes, see here. If you want to know why tornadoes lift things, see here).

The maximum area Gilroy presents is 1.5 m2. The wind force is calculated by multiplying this area by the kinetic energy loss per second 1/2ρv2, times a form factor.  F= (Area)*ƒ* 1/2ρv2, where ρ is the density of air, 1.29Kg/m3, and v is velocity, 22.3 m/s. The form factor, ƒ, is about 1.25 for this shape: ƒ is found to be 1.15 for a flat plane, and 1.1 to 1.3 a rough sphere or ski-jumper. F = 1.5*1.25* (1/2 *1.29*22.32) = 603 Nt = 134 lb.; pressure is this divided by area. Since the weight is only about 40 lbs, I find I have to tie down the sculpture. I’ve done that with a 150 lb rope, tying it to a steel vent pipe.

Wind speed for Detroit month by month. Used to calculate the force. From http://weatherspark.com/averages/30042/Detroit-Michigan-United-States

Wind speed for Detroit month by month. Used to calculate the force. From http://weatherspark.com/averages/30042/Detroit-Michigan-United-States

It is possible that there’s a viscous lift force too, but it is likely to be small given the blunt shape and the flow Reynolds number: 3190. There is also the worry that Gilroy might fall apart from vibration. Gilroy is made of 3/4″ plywood, treated for outdoor use and then painted, but the plywood is held together with 25 steel screws 4″ long x 1/4″ OD. Screws like this will easily hold 134 lbs of steady wind force, but a vibrating wind will cause fatigue in the metal (bend a wire often enough and it falls apart). I figure I can leave Gilroy up for a year or so without worry, but will then go up to replace the screws and check if I have to bring him/ it down.

In the meantime, I’ll want to add a sign under the sculpture: “REB Research, home of Mr Hydrogen” I want to keep things surreal, but want to be safe and make sales.

by Robert E. Buxbaum, June 21, 2013

Paint your factory roof white

Standing on the flat roof of my lab / factory building, I notice that virtually all of my neighbors’ roofs are black, covered by tar or bitumen. My roof was black too until three weeks ago; the roof was too hot to touch when I’d gone up to patch a leak. That’s not quite egg-frying hot, but I came to believe my repair would last longer if the roof stayed cooler. So, after sealing the leak with tar and bitumen, we added an aluminized over-layer from Ace hardware. The roof is cooler now than before, and I notice a major drop in air conditioner load and use.

My analysis of our roof coating follows; it’s for Detroit, but you can modify it for your location. Sunlight hits the earth carrying 1300 W/m2. Some 300W/m2 scatters as blue light (for why so much scatters, and why the sky is blue, see here). The rest, 1000 W/m2 or 308 Btu/ft2hr, comes through or reflects off clouds on a cloudy day and hits buildings at an angle determined by latitude, time of day, and season of the year.

Detroit is at 42° North latitude so my roof shows an angle of 42° to the sun at noon in mid spring. In summer, the angle is 20°, and in winter about 63°. The sun sinks lower on the horizon through the day, e.g. at two hours before or after noon in mid spring the angle is 51°. On a clear day, with a perfectly black roof, the heating is 308 Btu/ft2hr times the cosine of the angle.

To calculate our average roof heating, I integrated this heat over the full day’s angles using Euler’s method, and included the scatter from clouds plus an absorption factor for the blackness of the roof. The figure below shows the cloud cover for Detroit.

Average cloud cover for Detroit, month by month.

Average cloud cover for Detroit, month by month; the black line is the median cloud cover. On January 1, it is strongly overcast 60% of the time, and hardly ever clear; the median is about 98%. From http://weatherspark.com/averages/30042/Detroit-Michigan-United-States

Based on this and an assumed light absorption factor of σ = .9 for tar and σ = .2 after aluminum. I calculate an average of 105 Btu/ft2hr heating during the summer for the original black roof, and 23 Btu/ft2hr after aluminizing. Our roof is still warm, but it’s no longer hot. While most of the absorbed heat leaves the roof by black body radiation or convection, enough enters my lab through 6″ of insulation to cause me to use a lot of air conditioning. I calculate the heat entering this way from the roof temperature. In the summer, an aluminum coat is a clear winner.

Detroit High and Low Temperatures Over the ear

High and Low Temperatures For Detroit, Month by Month. From http://weatherspark.com/averages/30042/Detroit-Michigan-United-States

Detroit has a cold winter too, and these are months where I’d benefit from solar heat. I find it’s so cloudy in winter that, even with a black roof, I got less than 5 Btu/ft2hr. Aluminizing reduced this heat to 1.2 Btu/ft2hr, but it also reduces the black-body radiation leaving at night. I should find that I use less heat in winter, but perhaps more in late spring and early fall. I won’t know the details till next year, but that’s the calculation.

The REB Research laboratory is located at 12851 Capital St., Oak Park, MI 48237. We specialize in hydrogen separations and membrane reactors. By Dr. Robert Buxbaum, June 16, 2013

What’s the quality of your home insulation

By Dr. Robert E. Buxbaum, June 3, 2013

It’s common to have companies call during dinner offering to blow extra insulation into the walls and attic of your home. Those who’ve added this insulation find a small decrease in their heating and cooling bills, but generally wonder if they got their money’s worth, or perhaps if they need yet-more insulation to get the full benefit. Here’s a simple approach to comparing your home heat bill to the ideal your home can reasonably reach.

The rate of heat transfer through a wall, Qw, is proportional to the temperature difference, ∆T, to the area, A, and to the average thermal conductivity of the wall, k; it is inversely proportional to the wall thickness, ∂;

Qw = ∆T A k /∂.

For home insulation, we re-write this as Qw = ∆T A/Rw where Rw is the thermal resistance of the wall, measured (in the US) as °F/BTU/hr-ft2. Rw = ∂/k.

Lets assume that your home’s outer wall thickness is nominally 6″ thick (0.5 foot). With the best available insulation, perfectly applied, the heat loss will be somewhat higher than if the space was filled with still air, k=.024 BTU/fthr°F, a result based on molecular dynamics. For a 6″ wall, the R value, will always be less than .5/.024 = 20.8 °F/BTU/hr-ft2.. It will be much less if there are holes or air infiltration, but for practical construction with joists and sills, an Rw value of 15 or 16 is probably about as good as you’ll get with 6″ walls.

To show you how to evaluate your home, I’ll now calculate the R value of my walls based on the size of my ranch-style home (in Michigan) and our heat bills. I’ll first do this in a simplified calculation, ignoring windows, and will then repeat the calculation including the windows. Windows are found to be very important. I strongly suggest window curtains to save heat and air conditioning,

The outer wall of my home is 190 feet long, and extends about 11 feet above ground to the roof. Multiplying these dimensions gives an outer wall area of 2090 ft2. I could now add the roof area, 1750 ft2 (it’s the same as the area of the house), but since the roof is more heavily insulated than the walls, I’ll estimate that it behaves like 1410 ft2 of normal wall. I calculate there are 3500 ftof effective above-ground area for heat loss. This is the area that companies keep offering to insulate.

Between December 2011 and February 2012, our home was about 72°F inside, and the outside temperature was about 28°F. Thus, the average temperature difference between the inside and outside was about 45°F; I estimate the rate of heat loss from the above-ground part of my house, Qu = 3500 * 45/R = 157,500/Rw.

Our house has a basement too, something that no one has yet offered to insulate. While the below-ground temperature gradient is smaller, it’s less-well insulated. Our basement walls are cinderblock covered with 2″ of styrofoam plus wall-board. Our basement floor is even less well insulated: it’s just cement poured on pea-gravel. I estimate the below-ground R value is no more than 1/2 of whatever the above ground value is; thus, for calculating QB, I’ll assume a resistance of Rw/2.

The below-ground area equals the square footage of our house, 1750 ft2 but the walls extend down only about 5 feet below ground. The basement walls are thus 950 ft2 in area (5 x 190 = 950). Adding the 1750 ft2 floor area, we find a total below-ground area of 2700 ft2.

The temperature difference between the basement and the wet dirt is only about 25°F in the winter. Assuming the thermal resistance is Rw/2, I estimate the rate of heat loss from the basement, QB = 2700*25*(2/Rw) = 135,000/Rw. It appears that nearly as much heat leaves through the basement as above ground!

Between December and February 2012, our home used an average of 597 cubic feet of gas per day or 25497 BTU/hour (heat value = 1025 BTU/ ft3). QU+ Q= 292,500/Rw. Ignoring windows, I estimate Rw of my home = 292,500/25497 = 11.47.

We now add the windows. Our house has 230 ft2 of windows, most covered by curtains and/or plastic. Because of the curtains and plastic, they would have an R value of 3 except that black-body radiation tends to be very significant. I estimate our windows have an R value of 1.5; the heat loss through the windows is thus QW= 230*45/1.5 = 6900 BTU/hr, about 27% of the total. The R value for our walls is now re-estimated to be 292,500/(25497-6900) = 15.7; this is about as good as I can expect given the fixed thickness of our walls and the fact that I can not easily get an insulation conductivity lower than still air. I thus find that there will be little or no benefit to adding more above-ground wall insulation to my house.

To save heat energy, I might want to coat our windows in partially reflective plastic or draw the curtains to follow the sun. Also, since nearly half the heat left from the basement, I may want to lay a thicker carpet, or lay a reflective under-layer (a space blanket) beneath the carpet.

To improve on the above estimate, I could consider our furnace efficiency; it is perhaps only 85-90% efficient, with still-warm air leaving up the chimney. There is also some heat lost through the door being opened, and through hot water being poured down the drain. As a first guess, these heat losses are balanced by the heat added by electric usage, by the body-heat of people in the house, and by solar radiation that entered through the windows (not much for Michigan in winter). I still see no reason to add more above-ground insulation. Now that I’ve analyzed my home, it’s time for you to analyze yours.