The main products of my company, REB Research, involve metallic membranes, often palladium-based, that provide 100% selective hydrogen filtering or long term hydrogen storage. One way to understand why these metallic membrane provide 100% selectivity has to do with the fact that metallic atoms are much bigger than hydrogen ions, with absolutely regular, small spaces between them that fit hydrogen and nothing else.
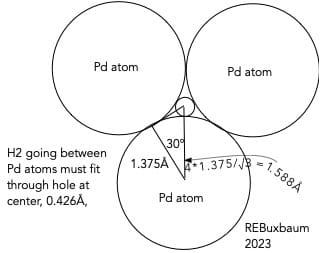
Palladium atoms are essentially spheres. In the metallic form, the atoms pack in an FCC structure (face-centered cubic) with a radius of, 1.375 Å. There is a cloud of free electrons that provide conductivity and heat transfer, but as far as the structure of the metal, there is only a tiny space of 0.426 Å between the atoms, see below. This hole is too small of any molecule, or any inert gas. In the gas phase hydrogen molecules are about 1.06 Å in diameter, and other molecules are bigger. Hydrogen atoms shrink when inside a metal, though, to 0.3 to 0.4 Å, just small enough to fit through the holes.
The reason that hydrogen shrinks has to do with its electron leaving to join palladium’s condition cloud. Hydrogen is usually put on the upper left of the periodic table because, in most cases, it behaves as a metal. Like a metal, it reacts with oxygen, and chlorine, forming stoichiometric compounds like H2O and HCl. It also behaves like a metal in that it alloys, non-stoichiometrically, with other metals. Not with all metals, but with many, Pd and the transition metals in particular. Metal atoms are a lot bigger than hydrogen so there is little metallic expansion on alloying. The hydrogen fits in the tiny spaces between atoms. I’ve previously written about hydrogen transport through transition metals (we provide membranes for this too).
No other atom or molecule fits in the tiny space between palladium atoms. Other atoms and molecules are bigger, 1.5Å or more in size. This is far too big to fit in a hole 0.426Å in diameter. The result is that palladium is basically 100% selective to hydrogen. Other metals are too, but palladium is particularly good in that it does not readily oxidize. We sometime sell transition metal membranes and sorbers, but typically coat the underlying metal with palladium.
We don’t typically sell products of pure palladium, by the way. Instead most of our products use, Pd-25%Ag or Pd-Cu. These alloys are slightly cheaper than pure Pd and more stable. Pd-25% silver is also slightly more permeable to hydrogen than pure Pd is — a win-win-win for the alloy.
My favorite fuel cells burn hydrogen-rich hydrocarbon fuels, like methane (natural gas) instead of pure hydrogen. Methane is far more energy dense, and costs far less than hydrogen per energy content. The US has plenty of methane and has pipelines that distribute it to every city and town. It’s a low CO2 fuel, and we can lower the CO2 impact further by mixing in hydrogen to get hythane. Elon Musk has called hydrogen- powered fuel cells “fool cells”, methane-powered fuel cells look a lot less foolish. They easily compete with his batteries and with gasoline. Besides, Musk has chosen methane as the fuel for his proposed starship to Mars.
Solid oxide fuel cells, SOFCs, can use methane directly without any pre-reformer. They operate at 800°C or so. At these temperatures, methane reacts with water (steam) within the fuel cell to form hydrogen by the reaction, CH4 + H2O –> 3H2 + CO. The hydrogen, and to a lesser extent the CO is oxidized in the fuel cell to create electricity,, but the methane is not 100% consumed, generally. Unused methane, CO, and some hydrogen exits a solid oxide fuel cell along with the products of combustion, CO2 and water.
Several researchers have looked for ways to recycle this waste fuel to capture the energy value. Six years ago, I patented a membrane method to extract the waste fuel and recycle it, see a description here. I now see this method as too complex, and have applied for a patent on a simpler version, shown below as Figure 1. As before the main work is done by a membrane but here I dispense with the water gas shift reactor, and many of the heat exchangers of the previous approach.
Simple way to improve fuel use in a high temperature fuel cell, using just a membrane.
The fuel cell system of Fig. 1 operates at somewhat elevated pressure, 2 atm or more. It is expected that the majority of the exhaust going to the membrane will be CO2 and water. Most of this will pass through the membrane and will exhaust to the air. The rest is mixed with fresh methane and recycles to the fuel cell. Despite the pressure of the fuel cell, very a little energy is needed for recirculation since the methane does not go through the membrane. The result is a light, simple, and energy efficient process. If you are interested, please contact me at REB Research. Or you can purchase the silicone membrane module here. Alternately, see here for flux information and other applications.
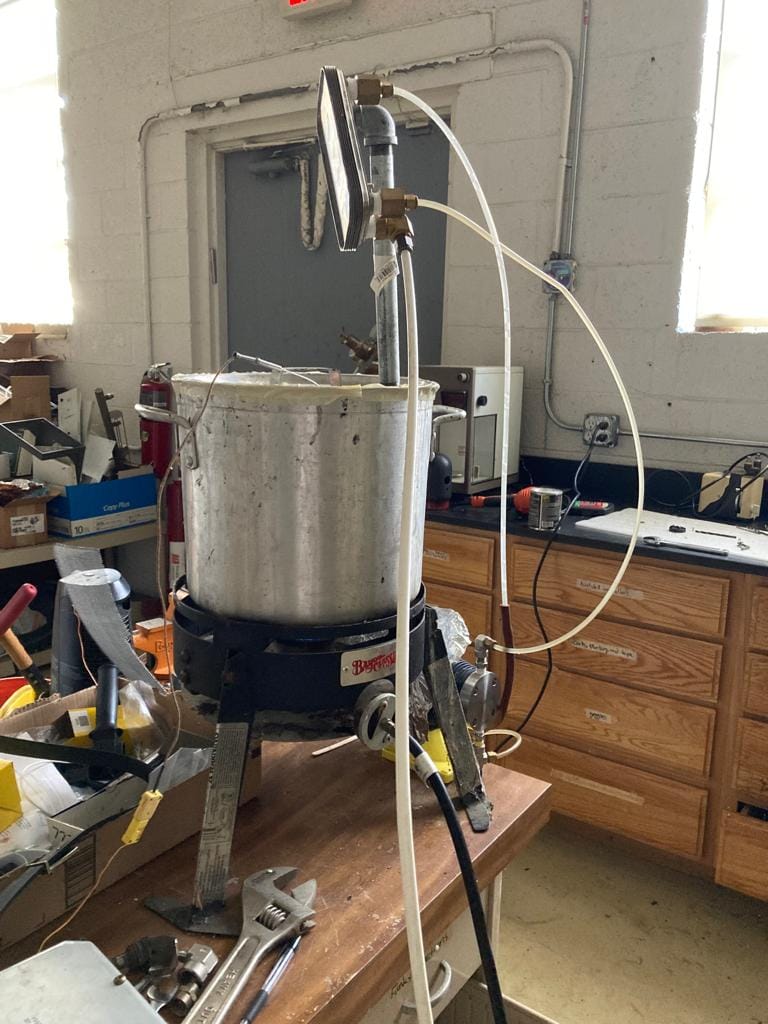
MY home-made still, and messy lab. Note the masking tape seal and the nylon hoses. Nylon is cheaper than copper. The yellow item behind the burner is the cooling water circulation pump. The wire at top and left is the thermocouple.
I have an apple tree, a peach tree, and some grape vines. They’re not big trees, but they give too much fruit to eat. The squirrels get some, and we give some away. As for the rest, I began making wine and apple jack a few years back, but there’s still more fruit than I can use. Being a chemical engineer, I decided to make brandy this year, so far only with pears and apples.
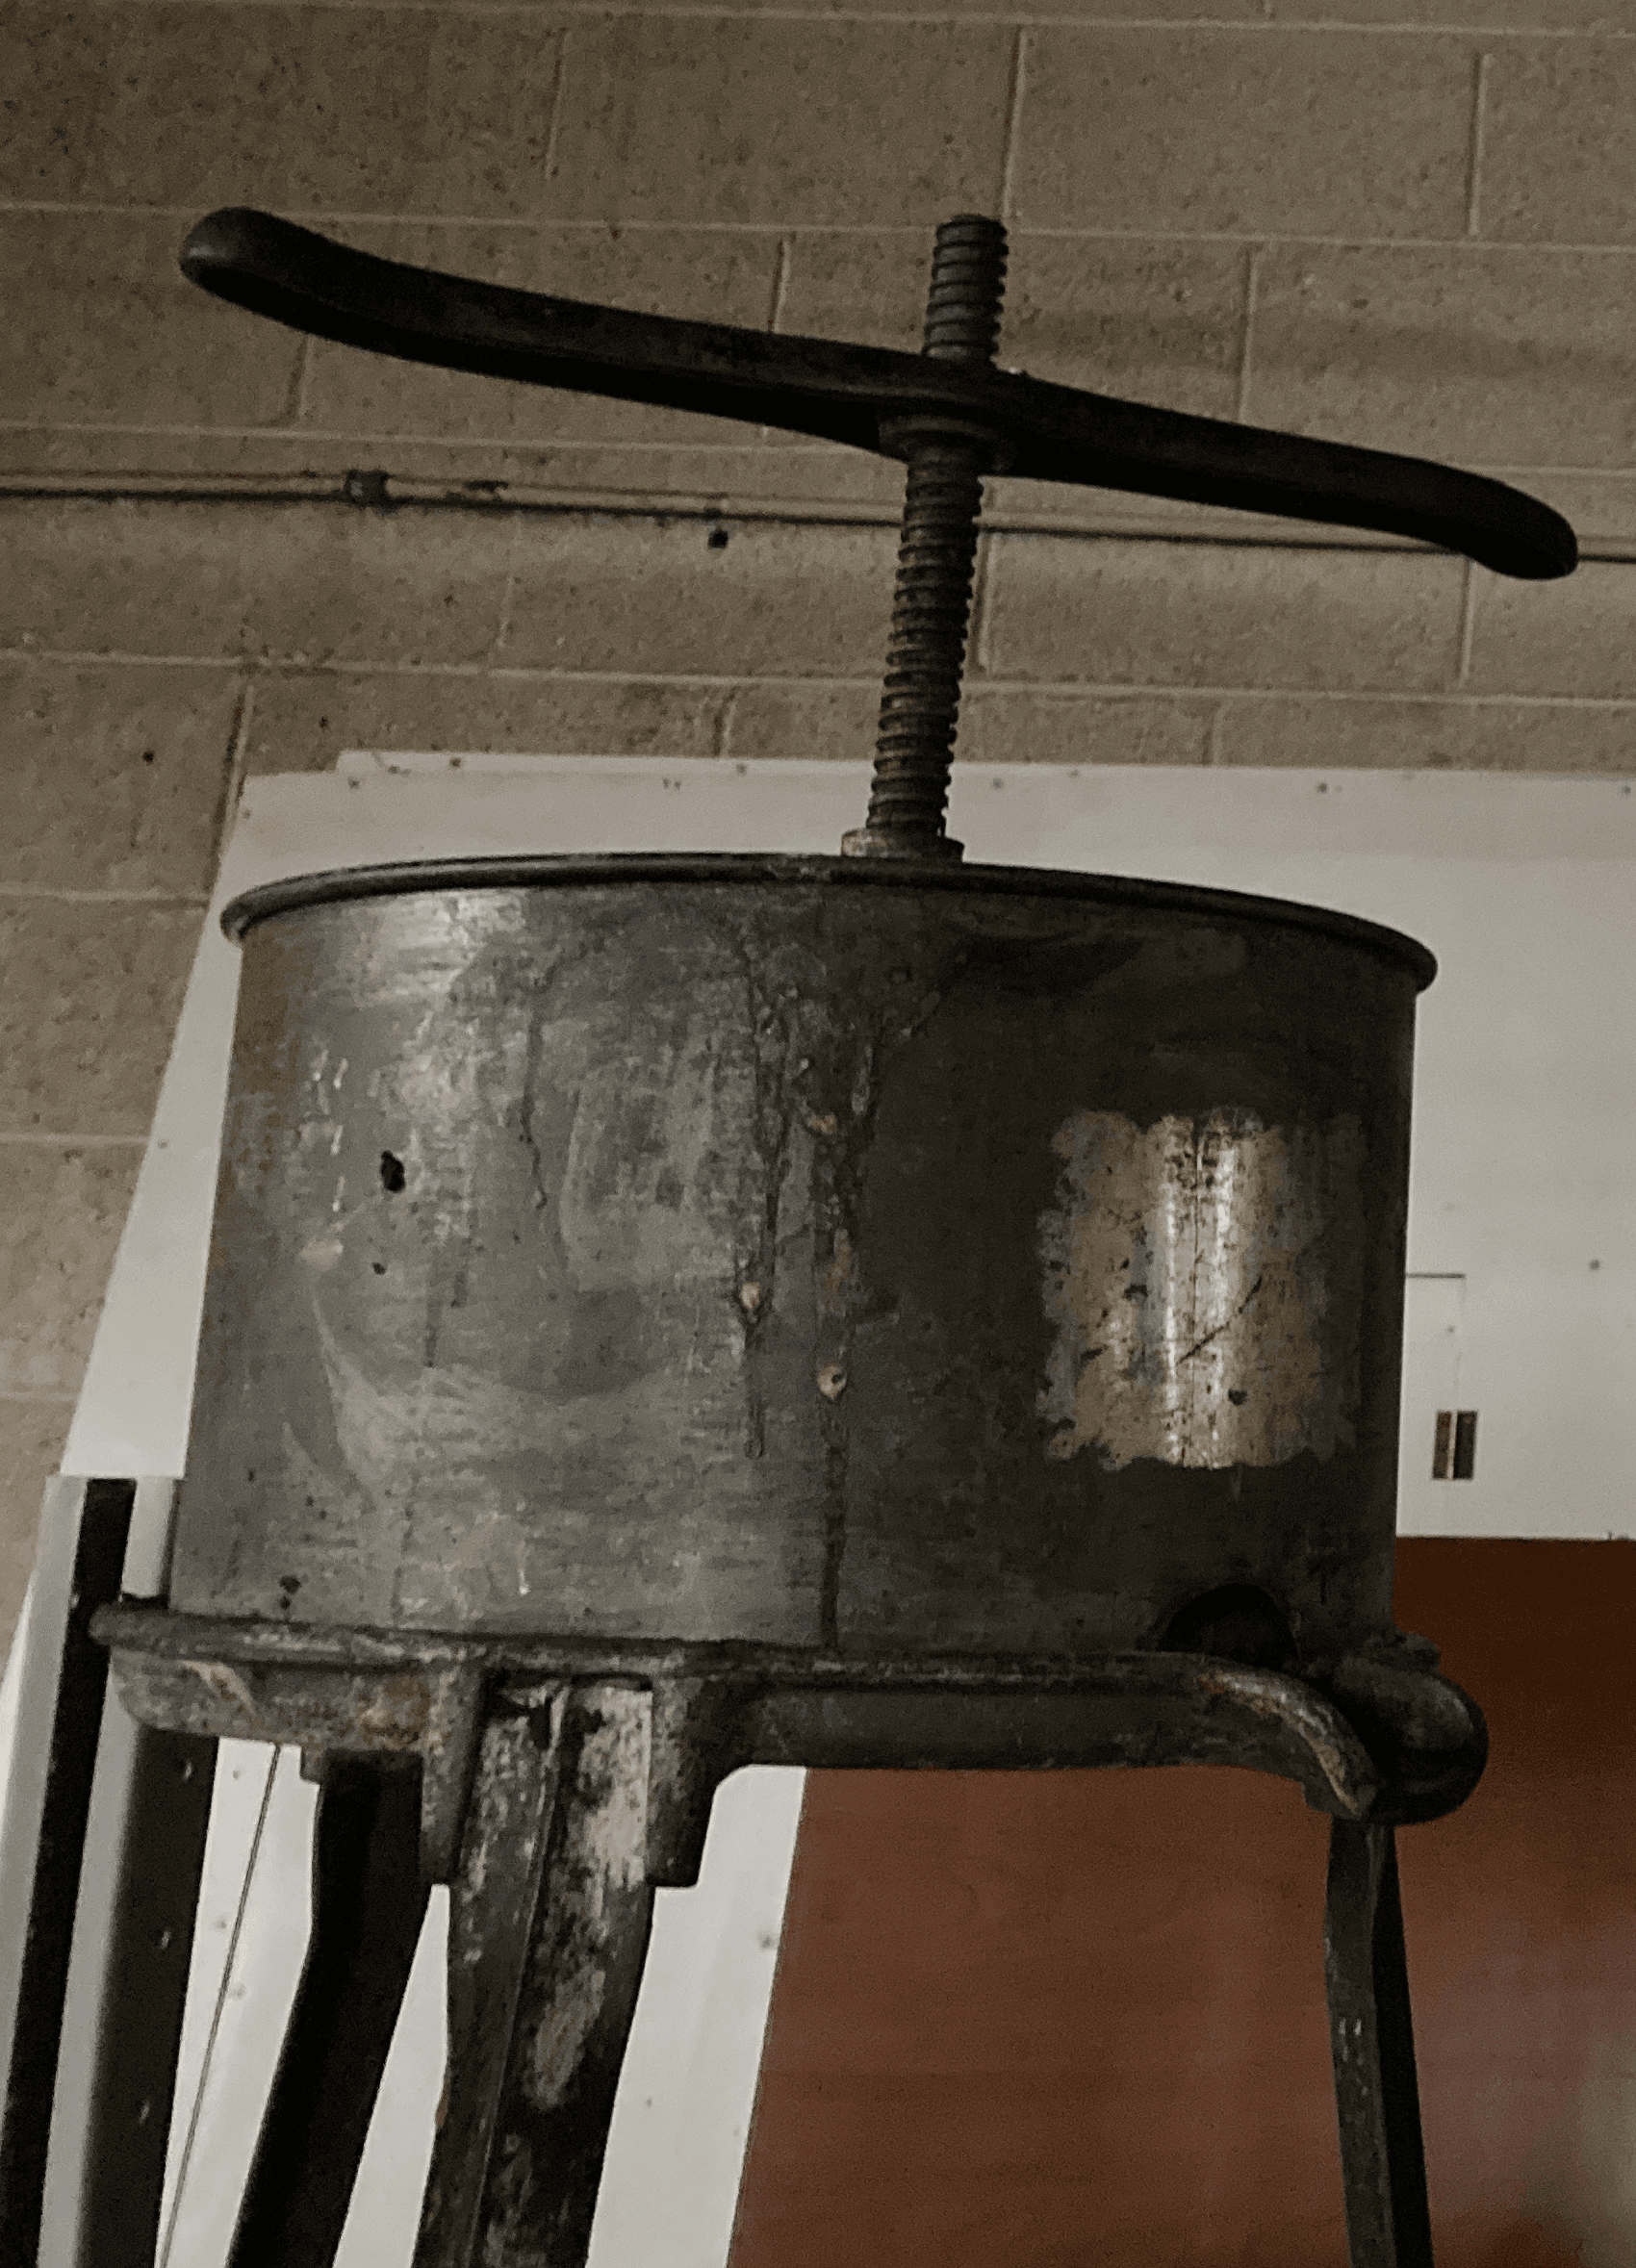
The first steps were the simplest: I collected fruit in a 5 gallon, Ace bucket, and mashed it using a 2×4. I then added some sugar and water and some yeast and let it sit with a cover for a week or two. Bread yeast worked fine for this, and gives a warm flavor, IMHO. A week or so later, I put the mush into a press I had fro grapes, shown below, and extracted the fermented juice. I used a cheesecloth bag with one squeezing, no bag with the other. The bag helped, making cleanup easier.
The fruit press, used to extract liquid. A cheese cloth bag helps.
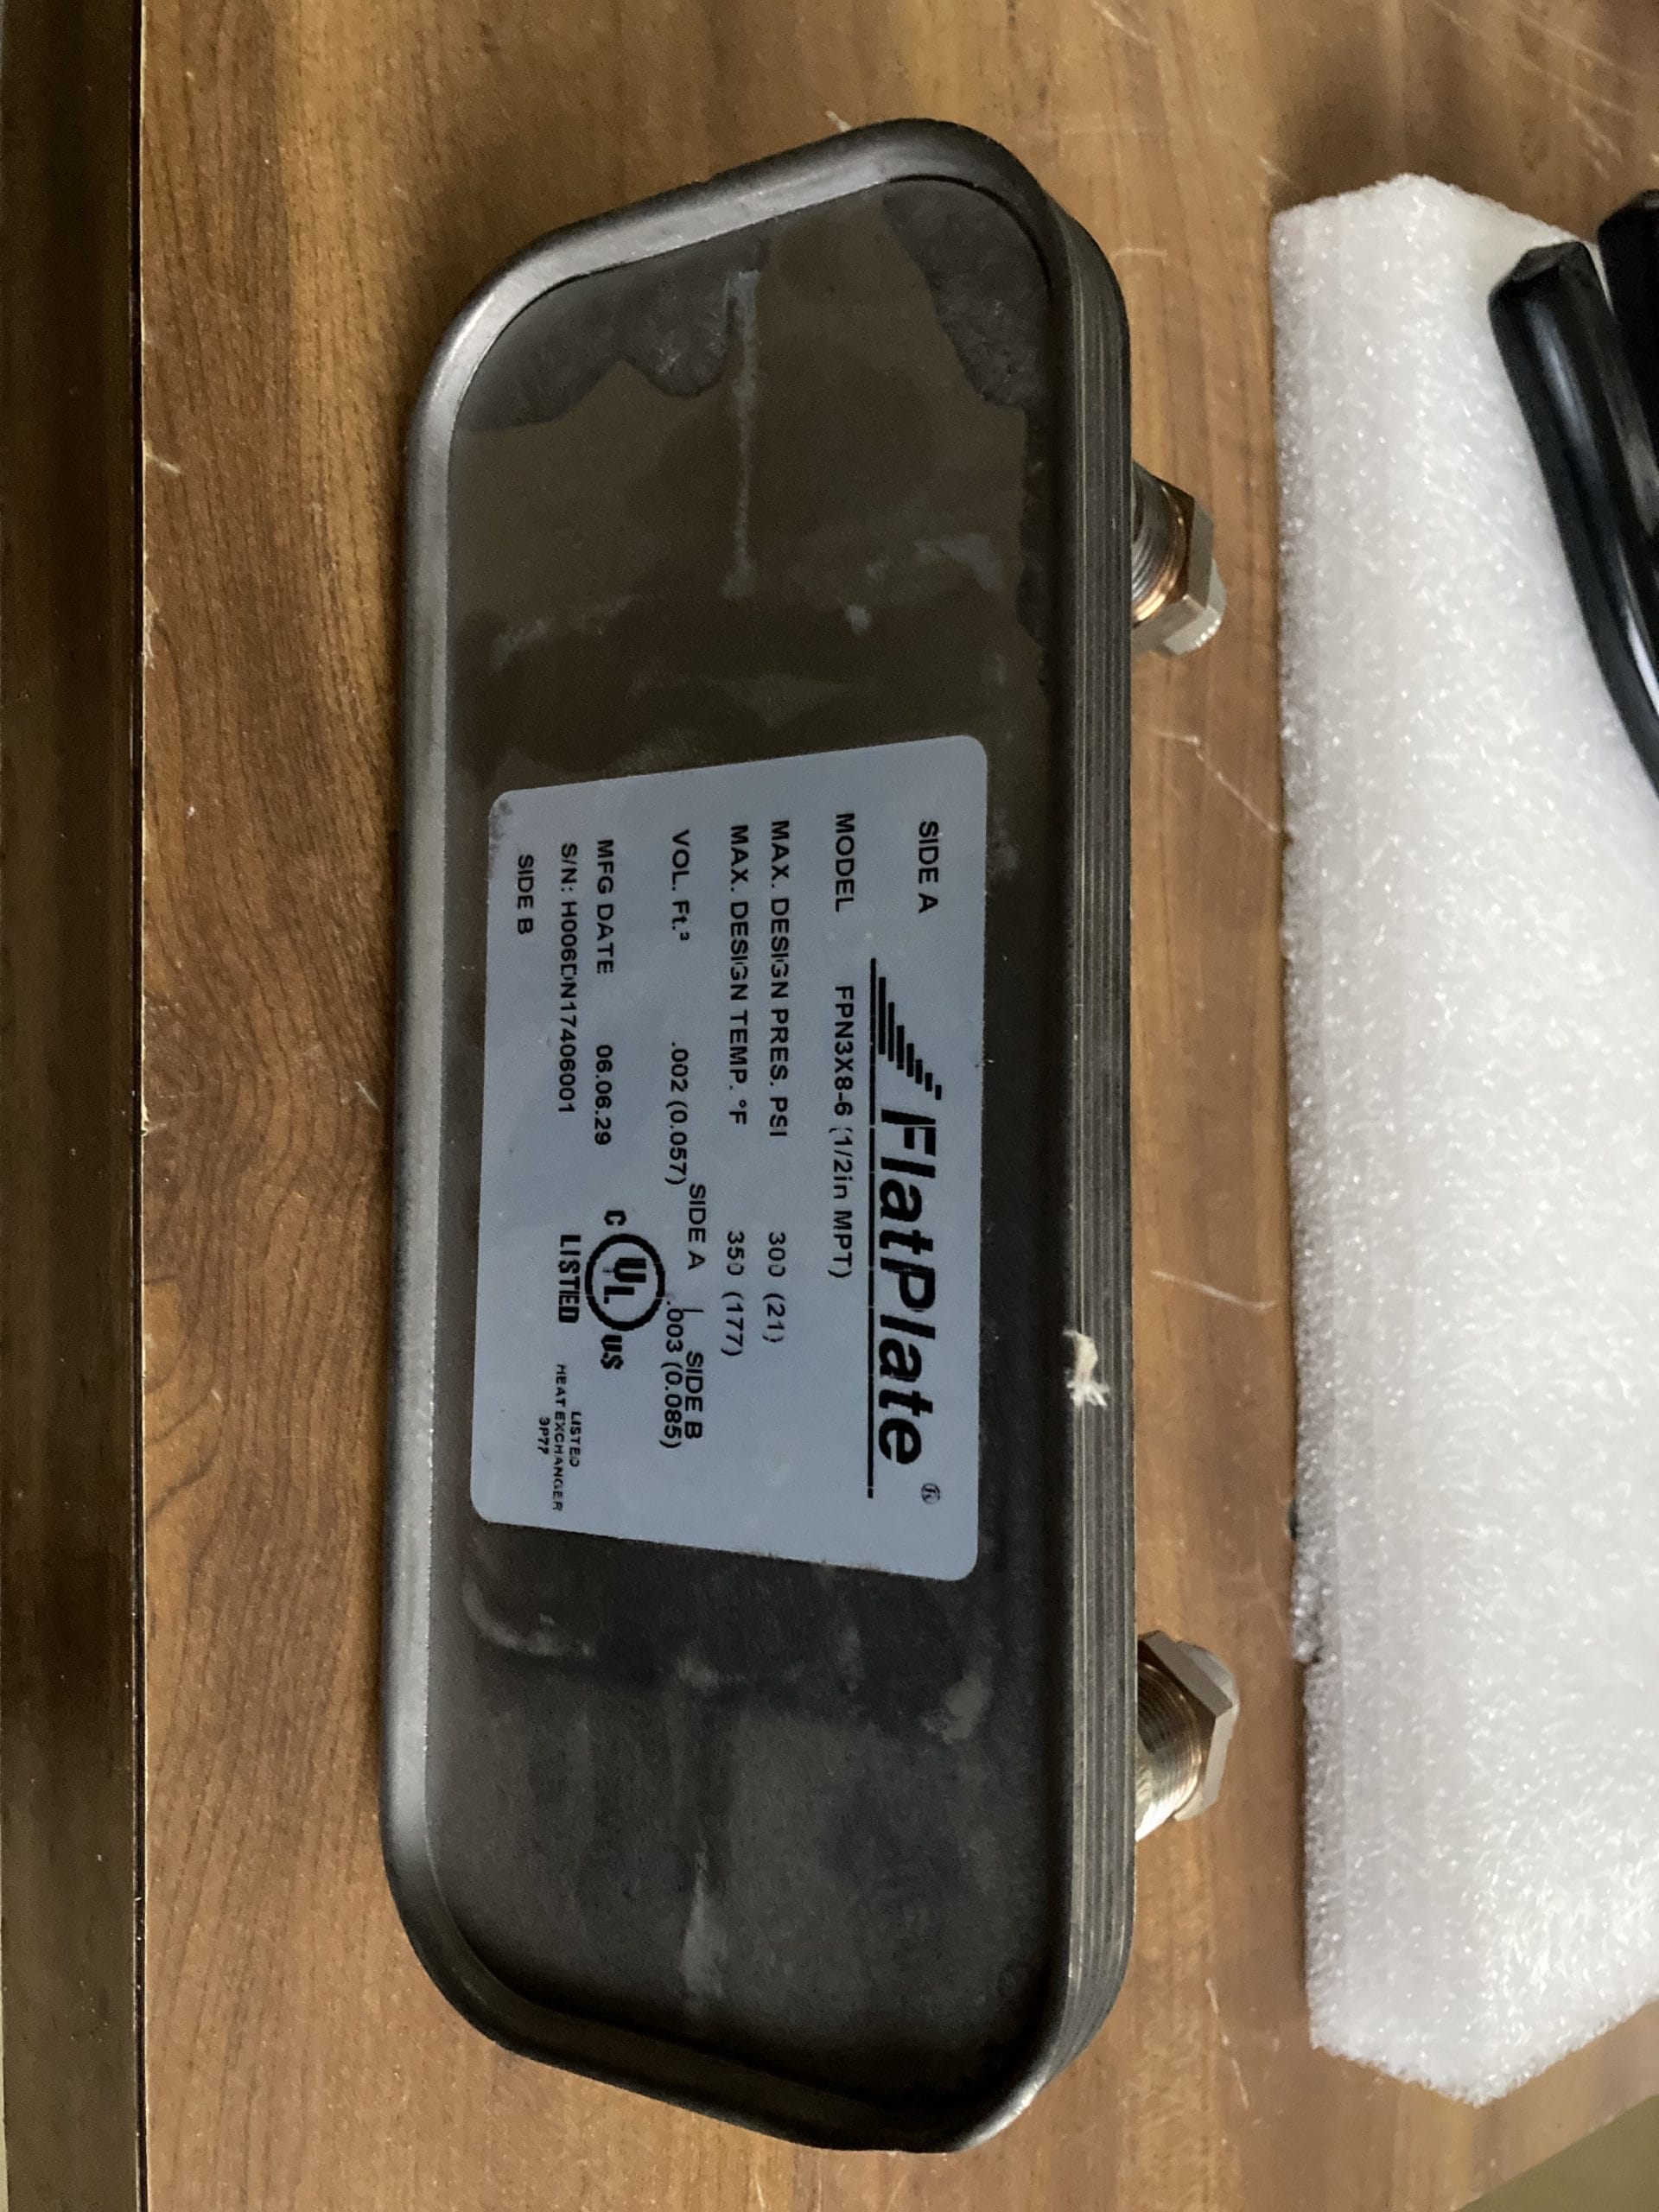
I did a second fermentation with both batches of fermented mash. This was done in a pot over a hot-plate on warm. I added more sugar and some more yeast and let it ferment for a few more days at about 78°F. To avoid bad yeasts, I washed out the pot and the ace bucket with dilute iodine before using them– I have lots of dilute iodine around from the COVID years. The product went into the aluminum “corn-cooker” shown above, 5 or 6 gallon size, that serves as the still boiler. The aluminum cover of the pot was drilled with a 1″ hole; I then screwed in a 10″ length of 3/4″ galvanized pipe, added a reducing elbow, and screwed that into a flat-plate heat exchanger, shown below. The heat exchanger serves as the condenser, while the 3/4″ pipe is like the cap on a moonshiner still. Its purpose is to keep the foam and splatter from getting in the condenser.
I put the pot on the propane burner stand shown, sealed the lid with masking tape (it worked better than duct tape), hooked up the heat exchanger to a water flow, and started cooking. If you don’t feel like making a still this way, you can buy one at Home Depot for about $150. Whatever route you go, get a good heat exchanger/ condenser. The one on the Home-depot still looks awful. You need to be able to take heat out as fast as the fire puts heat in, and you’ll need minimal pressure drop or the lid won’t seal. The Home Depot still has too little area and too much back-pressure, IMHO. Also, get a good thermometer and put it in the head-space of the pot. I used a thermocouple. Temperature is the only reasonable way to keep track of the progress and avoid toxic distillate.
A flat-plate heat exchanger, used as a condenser.
The extra weight of the heat exchanger and pipe helps hold the lid down, by the way, but it would not be enough if there was a lot of back pressure in the heat exchanger-condenser. If your lid doesn’t seal, you’ll lose your product. If you have problems, get a better heat exchanger. I made sure that the distillate flows down as it condenses. Up-flow adds back pressure and reduces condenser efficiency. I cooled the condenser with water circulated to a bucket with the cooling water flowing up, counter current to the distillate flow. I could have used tap water via a hose with proper fittings for cooling, but was afraid of major leaks all over the floor.
With the system shown, and the propane on high, it took about 20 minutes to raise the temperature to near boiling. To avoid splatter, I turned down the heater as the temperature approached 150°F. The first distillate came out at 165°F, a temperature that indicated it was not alcohol or anything you’d want to drink. I threw away the first 2-3 oz of this product. You can sniff or sip a tiny amount to convince yourself that this this is really nasty, acetone, I suspect, plus ethyl acetate, and maybe some ether and methanol. Throw it away!
After the first 2-3 ounces, I collected everything to 211°F. Product started coming in earnest at about 172°F. I ended distillation at 211°F when I’d collected nearly 3 quarts. For my first run, my electronic thermometer was off and I stopped too early — you need a good thermometer. The material I collected and was OK in taste, especially when diluted a bit. To test the strength, I set some on fire, the classic “100% proof test”, and diluted till it to about 70% beyond. This is 70% proof, by the classic method. I also tried a refractometer, comparing the results to whiskey. I was aiming for 60-80 proof (30-40%).
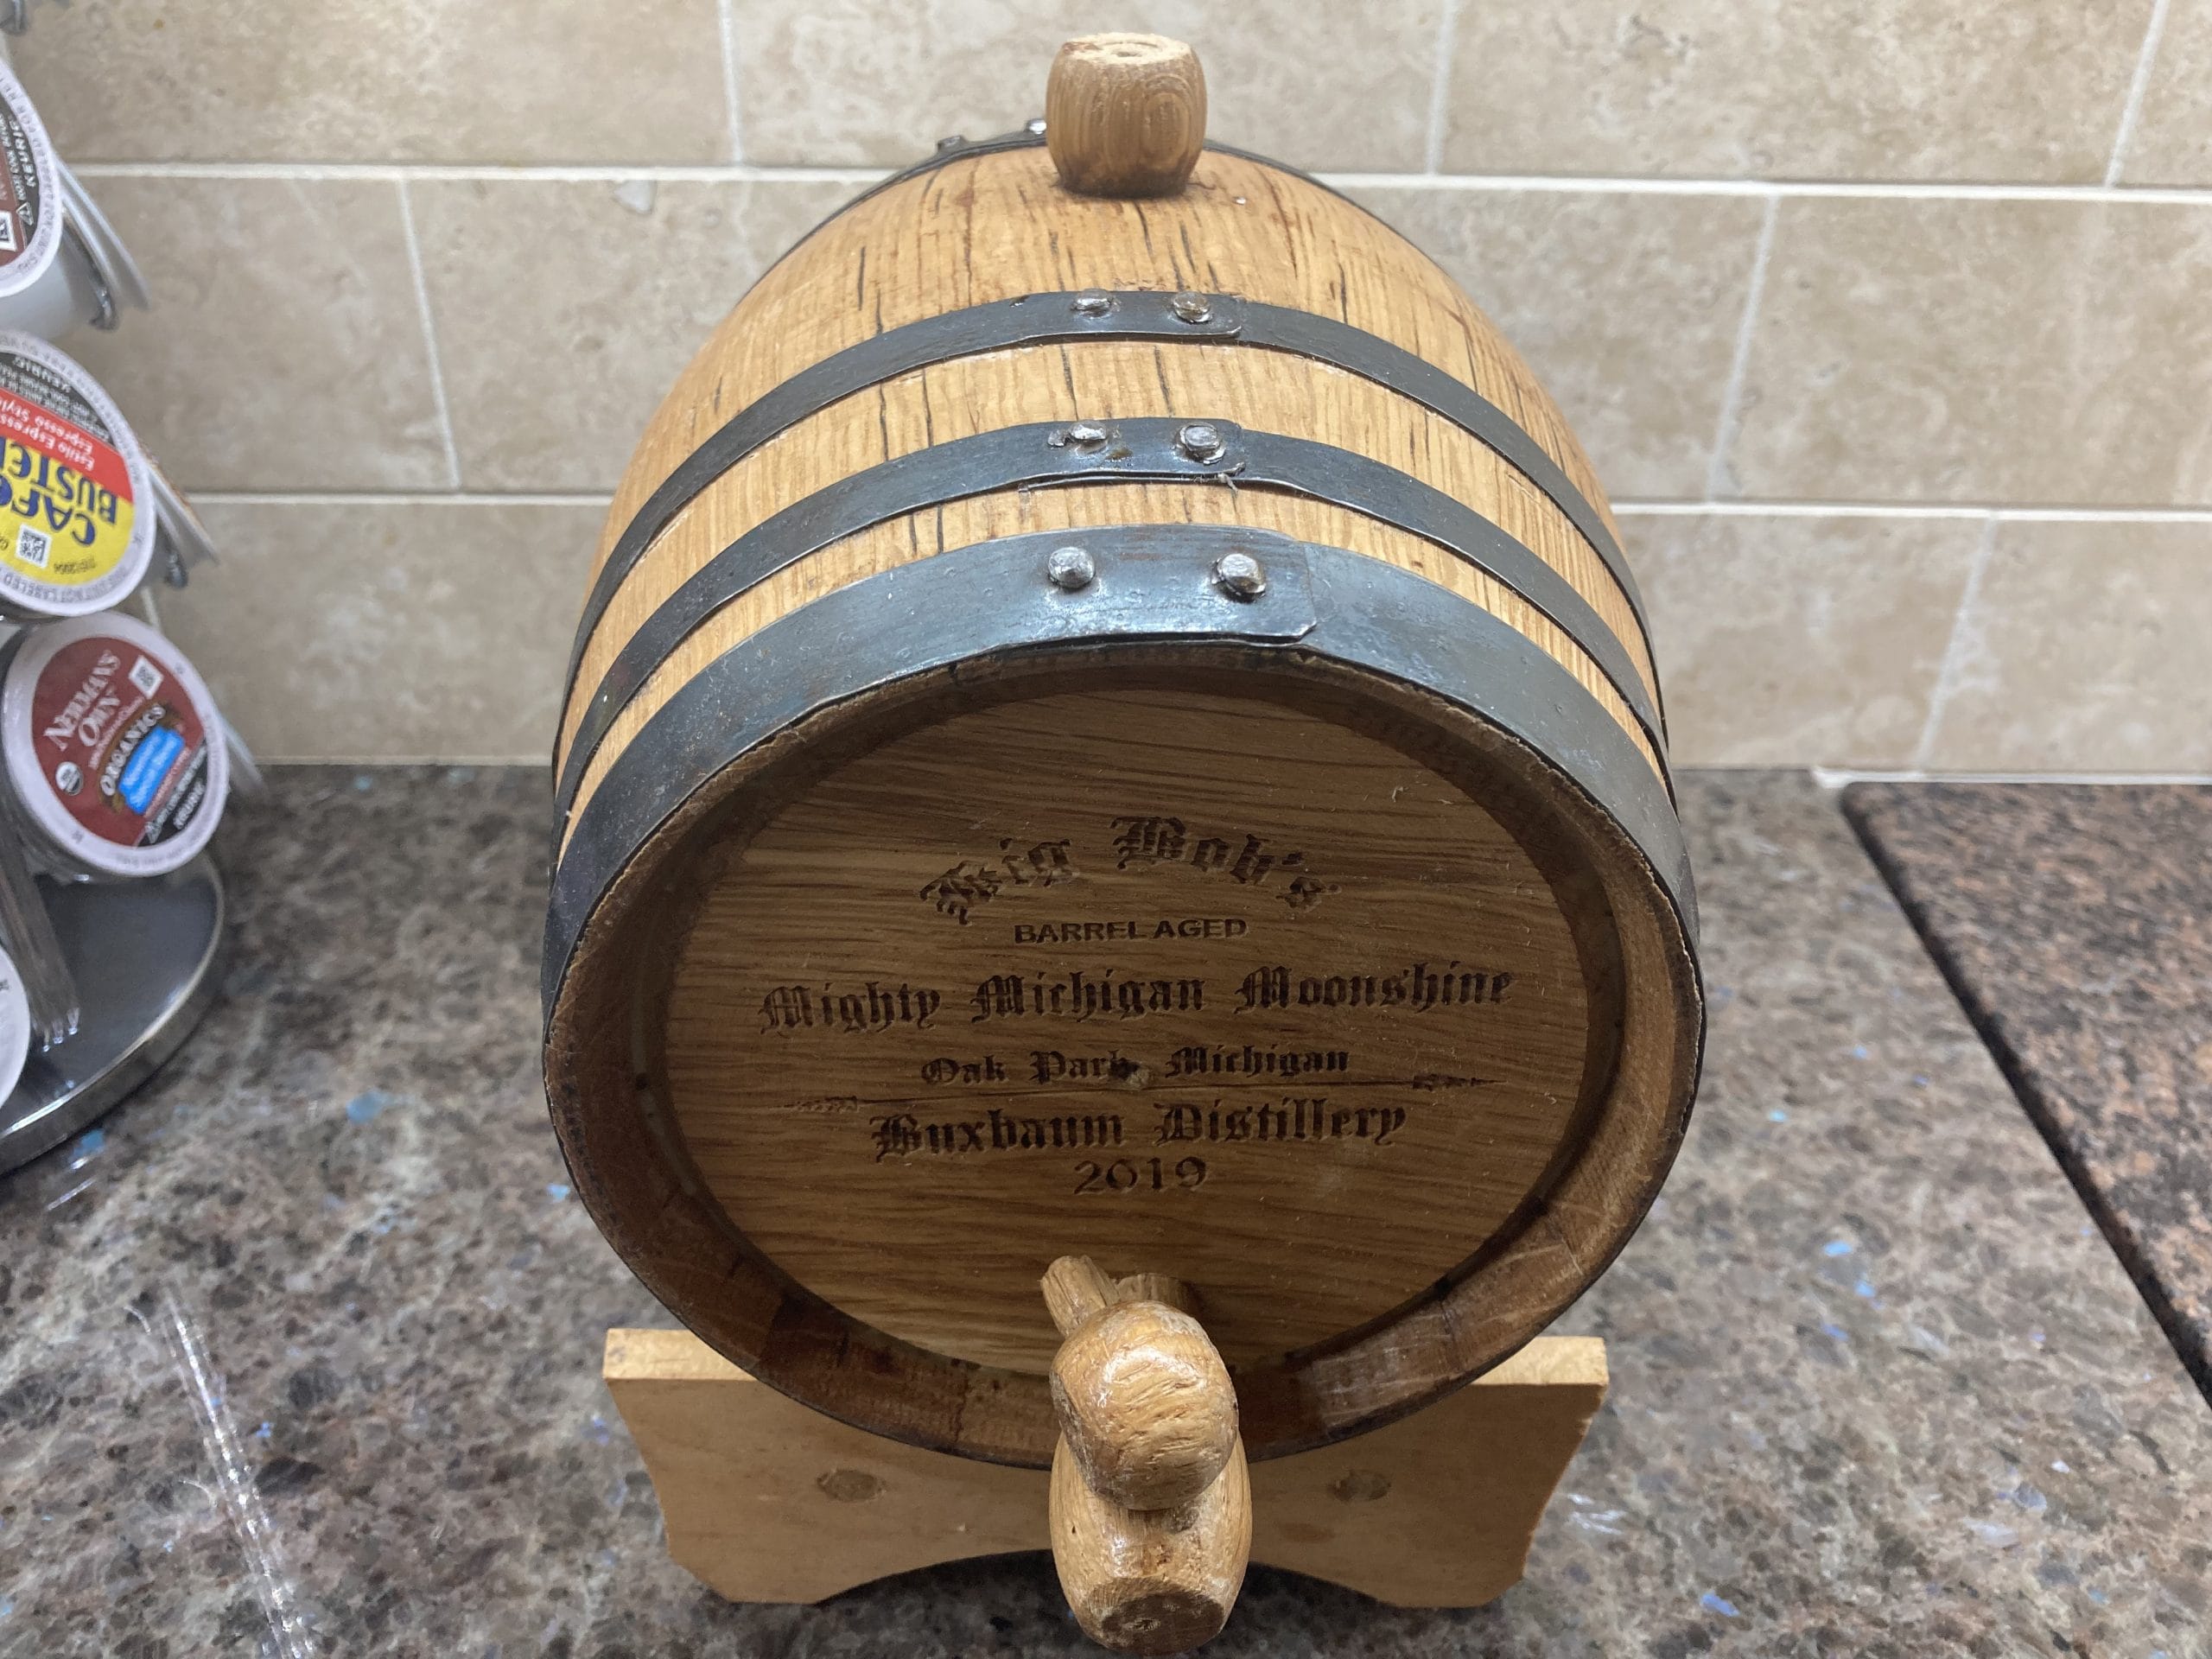
My 1 gallon aging barrel.
I tried distilling a second time to improve the flavor. The result was stronger, but much worse tasting with a loss of fruit flavor. By contrast, a much better resulted from putting some distillate (one pass) in an oak barrel we had used for wine. Just one day in the barrel helped a lot. I’ve also seen success putting charred wood cubes set into a glass bottle of distillate. Note: my barrel, as purchased, had leaks. I sealed them with wood glue before use.
I only looked up distilling law after my runs. It varies state to state. In Michigan, making spirits for consumption, either 1 gal or 60,000 gal/year, requires a “Distilling, Rectifying, Blending and/or Bottling Spirits” Permit, from the ATF Tax and Trade Bureau (“TTB”) plus a Small Distiller license from Michigan. Based on the sale of stills at Home Depot and a call to the ATF, it appears there is little interest in pursuing home distillers who do not sell, despite the activity being illegal. This appears similar to state of affairs with personal use marijuana growers in the state. Your state’s laws may be different, and your revenuers may be more enthusiastic. If you decide to distill, here’s some music, the Dukes of Hazard theme song.
There are two ASTM-approved methods for measuring the gas permeability of a material. The equipment is very similar, and REB Research makes equipment for either. In one of these methods (described in detail here) you measure the rate of pressure rise in a small volume.This method is ideal for high permeation rate materials. It’s fast, reliable, and as a bonus, allows you to infer diffusivity and solubility as well, based on the permeation and breakthrough time.
Exploded view of the permeation cell.
For slower permeation materials, I’ve found you are better off with the other method: using a flow of sampling gas (helium typically, though argon can be used as well) and a gas-sampling gas chromatograph. We sell the cells for this, though not the gas chromatograph. For my own work, I use helium as the carrier gas and sampling gas, along with a GC with a 1 cc sampling loop (a coil of stainless steel tube), and an automatic, gas-operated valve, called a sampling valve. I use a VECO ionization detector since it provides the greatest sensitivity differentiating hydrogen from helium.
When doing an experiment, the permeate gas is put into the upper chamber. That’s typically hydrogen for my experiments. The sampling gas (helium in my setup) is made to flow past the lower chamber at a fixed, flow rate, 20 sccm or less. The sampling gas then flows to the sampling loop of the GC, and from there up the hood. Every 20 minutes or so, the sampling valve switches, sending the sampling gas directly out the hood. When the valve switches, the carrier gas (helium) now passes through the sampling loop on its way to the column. This sends the 1 cc of sample directly to the GC column as a single “injection”. The GC column separates the various gases in the sample and determines the components and the concentration of each. From the helium flow rate, and the argon concentration in it, I determine the permeation rate and, from that, the permeability of the material.
As an example, let’s assume that the sample gas flow is 20 sccm, as in the diagram above, and that the GC determines the H2 concentration to be 1 ppm. The permeation rate is thus 20 x 10-6 std cc/minute, or 3.33 x 10⁻⁷ std cc/s. The permeability is now calculated from the permeation area (12.56 cm2 for the cells I make), from the material thickness, and from the upstream pressure. Typically, one measures the thickness in cm, and the pressure in cm of Hg so that 1 atm is 76cm Hg. The result is that permeability is determined in a unit called barrer. Continuing the example above, if the upstream hydrogen is 15 psig, that’s 2 atmospheres absolute or or 152 cm Hg. Lets say that the material is a polymer of thickness is 0.3 cm; we thus conclude that the permeability is 0.524 x 10⁻¹⁰ scc/cm/s/cm2/cmHg = 0.524 barrer.
This method is capable of measuring permeabilities lower than the previous method, easily lower than 1 barrer, because the results are not fogged by small air leaks or degassing from the membrane material. Leaks of oxygen, and nitrogen show up on the GC output as peaks that are distinct from the permeate peak, hydrogen or whatever you’re studying as a permeate gas. Another plus of this method is that you can measure the permeability of multiple gas species simultaneously, a useful feature when evaluating gas separation polymers. If this type of approach seems attractive, you can build a cell like this yourself, or buy one from us. Send us an email to reb@rebresearch.com/blog/, or give us a call at 248-545-0155.
Platinum catalysts can be very effective at removing hydrogen from air. Platinum promotes the irreversible reaction of hydrogen with oxygen to make water: H2 + 1/2 O2 –> H2O, a reaction that can take off, at great rates, even at temperatures well below freezing. In the 1800s, when platinum was cheap, platinum powder was used to light town-gas, gas street lamps. In those days, street lamps were not fueled by methane, ‘natural gas’, but by ‘town gas’, a mix of hydrogen and carbon monoxide and many impurities like H2S. It was made by reacting coal and steam in a gas plant, and it is a testament to the catalytic power of Pt that it could light this town gas. These impurities are catalytic poisons. When exposed to any catalyst, including platinum, the catalyst looses it’s power to. This is especially true at low temperatures where product water condenses, and this too poisons the catalytic surface.
Nowadays, platinum is expensive and platinum catalysts are no longer made of Pt powder, but rather by coating a thin layer of Pt metal on a high surface area substrate like alumina, ceria, or activated carbon. At higher temperatures, this distribution of Pt improves the reaction rate per gram Pt. Unfortunately, at low temperatures, the substrate seems to be part of the poisoning problem. I think I’ve found a partial way around it though.
My company, REB Research, sells Pt catalysts for hydrogen removal use down to about 0°C, 32°F. For those needing lower temperature hydrogen removal, we offer a palladium-hydrocarbon getter that continues to work down to -30°C and works both in air and in the absence of air. It’s pretty good, but poisons more readily than Pt does when exposed to H2S. For years, I had wanted to develop a version of the platinum catalyst that works well down to -30°C or so, and ideally that worked both in air and without air. I got to do some of this development work during the COVID downtime year.
My current approach is to add a small amount of teflon and other hydrophobic materials. My theory is that normal Pt catalysts form water so readily that the water coats the catalytic surface and substrate pores, choking the catalyst from contact with oxygen or hydrogen. My thought of why our Pd-organic works better than Pt is that it’s part because Pd is a slower water former, and in part because the organic compounds prevent water condensation. If so, teflon + Pt should be more active than uncoated Pt catalyst. And it is so.
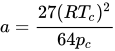
where is molar volume. The substance-specific constants and can be understood as an attraction force between molecules and a molecular volume respectively. Alternately, they can be calculated from the critical temperature and pressure as
Now, I’m going to assume that the effect of a hydrophobic surface near the Pt is to reduce the effective value of a. This is to say that water molecules still attract as before, but there are fewer water molecules around. I’ll assume that b remains the same. Thus the ratio of Tc and Pc remains the same but the values drop by a factor of related to the decrease in water density. If we imagine the use of enough teflon to decrease he number of water molecules by 60%, that would be enough to reduce the critical temperature by 60%. That is, from 647 K (374 °C) to 359 K, or -14°C. This might be enough to allow Pt catalysts to be used for H2 removal from the gas within a nuclear wast casket. I’m into nuclear, both because of its clean power density and its space density. As for nuclear waste, you need these caskets.
I’ve begun to test of my theory by making hydrogen removal catalyst that use both platinum and palladium along with unsaturated hydrocarbons. I find it works far better than the palladium-hydrocarbon getter, at least at room temperature. I find it works well even when the catalyst is completely soaked in water, but the real experiments are yet to come — how does this work in the cold. Originally I planned to use a freezer for these tests, but I now have a better method: wait for winter and use God’s giant freezer.
It is a fundamental of science that that the properties of every pure one-phase material is totally fixed properties at any given temperature and pressure. Thus for example, water at 0°C is accepted to always have a density of 0.998 gm/cc, a vapor pressure of 17.5 Torr, a viscosity of 1.002 centipoise (milliPascal seconds) and a speed of sound of 1481 m/s. Set the temperature and pressure of any other material and every other quality is set. But things go screwy near surfaces, and this is particularly true for water where the hydrogen bond — a quantum bond — predominates.
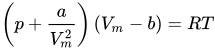
its vapor pressure rises and it becomes less inclined to condense or freeze. I use this odd aspect of thermodynamics to keep my platinum-based hydrogen getter catalysis active at low temperatures where they would normally clog. Normal platinum catalysts are not suitable for hydrogen removal at normal temperatures, eg room temperature, because the water that forms from hydrogen oxidation chokes off the catalytic surface. Hydrophobic additions prevent this, and I’d like to show you why this works, and why other odd things happen, based on an approximation called the Van der Waals equation of state:
(1)
This equation described the molar volume of a pure material, , of any pure material based not the pressure, the absolute temperature (Kelvin) and two, substance-specific constants, and . These constants can be understood as an attraction force term, and a molecular volume respectively. It is common to calculate a and b from the critical temperature and pressure as follows, where Tc is absolute temperature:
, (2 a,b)
For water Tc = 647 K (374°C) and 220.5 bar. Plugging in these numbers, the Van der Waals gives reasonable values for the density of water both as a liquid and a gas, and thus gives a reasonable value for the boiling point.
Now consider the effect that an inert surface would have on the effective values of a and b near that surface. The volume of the molecules will not change, and thus b will not change, but the value of a will change, likely by about half. This is because, the number of molecules surrounding any other molecule is reduced by about half while the inert surface adds nothing to the attraction. Near a surface, surrounding molecules still attract each other the same as before, but there are about half as many molecules at any temperature and pressure.
To get a physical sense of what the surface does, consider using the new values of a and b to determine a new value for Tc and Pc, for materials near the surface. Since b does not change, we see that the presence of a surface does not affect the ratio of Tc and Pc, but it decreases the effective value of Tc — by about half. For water, that is a change from 647 K to 323.5K, 50.5°C, very close to room temperature. Pc changes to 110 bar, about 1600 psi. Since the new value of Tc is close to room temperature, the the density of water will be much lower near the surface, and the viscosity can be expected to drop. The net result is that water flows more readily through a teflon pipe than through an ordinary pipe, a difference that is particularly apparent at small diameters.
This decrease in effective Tc is useful for fire hoses, and for making sailing ships go faster (use teflon paint) and for making my hydrogen removal catalysts more active at low temperatures. Condensed water can block the pores to the catalyst; teflon can forestall this condensation. It’s a general trick of thermodynamics, reasonably useful. Now you know it, and now you know why it works.
It’s not uncommon for scientists to get inspiration from popular music. I’d already written about how the song ‘City of New Orleans’ inspires my view of the economics of trains, I’d now like to talk about dealing with nuclear waste, and how the song Alice’s Restaurant affects my outlook.
The best way to get rid of nuclear waste would be (as I’ve blogged) to use a fast nuclear reactor to turn the worst components into more energy and less-dangerous elements. Unfortunately doing this requires reprocessing, and reprocessing was banned by Jimmy Carter, one of my least favorite presidents. The alternative is to store the nuclear waste indefinitely, waiting for someone to come up with a solution, like allowing it to be buried in Yucca Mountain, the US burial site that was approved, but that Obama decided should not be used. What then? We have nuclear waste scattered around the country, waiting. I was brought in as part of a think-tank, to decide what to do with it, and came to agree with several others, and with Arlo Guthrie, that one big pile [of waste] Is better than two little piles. Even if we can’t bury it, it would be better to put the waste in fewer places (other countries bury their waste, BTW).
That was many years ago, but even the shipping of waste has been held up as being political. Part of the problem is that nuclear waste gives off hydrogen — the radiation knocks hydrogen atoms off of water, paper, etc. and you need to keep the hydrogen levels low to be able to transport the waste safely. As it turns out we are one a few companies that makes hydrogen removal pellets and catalysts. Our products have found customers running tourist submarines (lead batteries also give off hydrogen) and customers making sealed electronics, and we are waiting for the nuclear shipping industry to open up. In recent months, I’ve been working on improving our products so they work better at low temperature. Perhaps I’ll write about that later, but here’s where you’d go to buy our current products.
Robert Buxbaum, July 4, 2021. I’ve done a few hydrogen-related posts in a row now. In part that’s because I’d noticed that I went a year or two talking history and politics, and barely talking about H2. I know a lot about hydrogen — that’s my business– as for history or politics, who knows.
I month ago, I wrote to endorse hythane, a mix of natural gas (methane) and 20-40% hydrogen. This mix is ideal for mobile use in solid oxide fuel cell vehicles, and not bad with normal IC engines. I’d now like to write about the advantages of an on-broad hydrogen generator to allow adjustable composition fuel mixes.
A problem you may have noticed with normal car engines is that a high hp engine will get lower miles per gallon, especially when you’re driving slow. That seems very strange; why should a bigger engine use more gas than a dinky engine, and why should you get lower mpg when you drive slow. The drag force on a vehicle is proportional to speed squared. You’d expect better milage at low speeds– something that textbooks claim you will see, counter to experience.
Behind these two problems are issues of fuel combustion range and pollution. You can solve both issues with hydrogen. With normal gasoline or Diesel engines, you get more or less the same amount of air per engine rotation at all rpm speeds, but the amount of air is much higher for big engines. There is a relatively small range of fuel-air mixes that will burn, and an even smaller range that will burn at low pollution. You have to add at least the minimal fuel per rotation to allow the engine to fire. For most driving that’s the amount the carburetor delivers. Because of gearing, your rpm is about the same at all speeds, you use almost the same rate of fuel at all speeds, with more fuel used in big engines. A gas engine can run lean, but normally speaking it doesn’t run at all any leaner than about 1.6 times the stoichiometric air-to-fuel mix. This is called a lambda of 1.6. Adding hydrogen extends the possible lambda range, as shown below for a natural gas – fired engine.
Engine efficiency when fueled with natural gas plus hydrogen as a function of hydrogen amount and lambda, the ratio of air to stoichiometric air.
The more hydrogen in the mix the wider the range, and the less pollution generally. Pure hydrogen burns at ten times stoichiometric air, a lambda of ten. There is no measurable pollution there, because there is no carbon to form CO, and temperature is so low that you don’t form NOx. But the energy output per rotation is low (there is not much energy in a volume of hydrogen) and hydrogen is more expensive than gasoline or natural gas on an energy basis. Using just a little hydrogen to run an engine at low load may make sense, but the ideal mix of hydrogen and ng fuel will change depending on engine load. At high load, you probably want to use no hydrogen in the mix.
As it happens virtually all of most people’s driving is at low load. The only time when you use the full horse-power is when you accelerate on a highway. An ideal operation for a methane-fueled car would add hydrogen to the carburetor intake at about 1/10 stoichiometric when the car idles, turning down the hydrogen mix as the load increases. REB Research makes hydrogen generators based on methanol reforming, but we’ve yet to fit one to a car. Other people have shown that adding hydrogen does improve mpg.
Carburetor Image from a course “Farm Power”. See link here. Adding hydrogen means you could use less gas.
Adding hydrogen plus excess air means there is less pollution. There is virtually no CO at idle because there is virtually no carbon, and even at load because combustion is more efficient. The extra air means that combustion is cooler, and thus you get no NOx or unburned HCs, even without a catalytic converter. Hydrogen is found to improve combustion speed and extent. A month ago, I’d applied for a grant to develop a hydrogen generator particularly suited to methane engines. Sorry to say, the DoT rejected my proposal.
We live in a throw-away society, and the majority of it, eventually makes its way to a landfill. Books, food, grass clippings, tree-products, consumer electronics; unless it gets burnt or buried at sea, it goes to a landfill and is left to rot underground. The product of this rot is a gas, landfill gas, and it has a fairly high energy content if it could be tapped. The composition of landfill gas changes, but after the first year or so, the composition settles down to a nearly 50-50 mix of CO2 and methane. There is a fair amount of water vapor too, plus some nitrogen and hydrogen, but the basic process is shown below for wood decomposition, and the products are CO2 and methane.
System for sewage gas upgrading, uses REB membranes.
C6 H12 O6 –> 3 CO2 + 3 CH4
This mix can not be put in the normal pipeline: there is too much CO2 and there are too many other smelly or condensible compounds (water, methanol, H2S…). This gas is sometimes used for heat on site, but there is a limited need for heat near a landfill. For the most part it is just vented or flared off. The waste of a potential energy source is an embarrassment. Besides, we are beginning to notice that methane causes global-warming with about 50 times the effect of CO2, so there is a strong incentive to capture and burn this gas, even if you have no use for the heat. I’d like to suggest a way to use the gas.
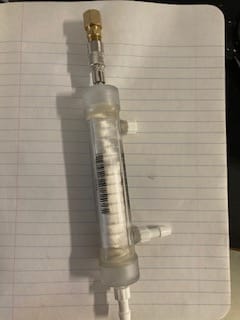
We sell small membrane modules too.
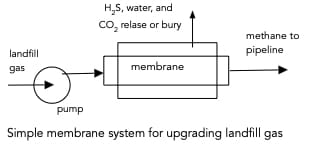
The landfill gas can be upgraded by removing the CO2. This can be done via a membrane, and REB Research sells a membranes that can do this. Other companies have other membranes that can do this too, but ours are smaller, and more suitable to small operations in my opinion. Our membrane are silicone-based. They retain CH4 and CO and hydrogen, while extracting water, CO2 and H2S, see schematic. The remainder is suited for local use in power generation, or in methanol production. It can also be used to run trucks. Also the gas can be upgraded further and added to a pipeline for shipping elsewhere. The useless parts can be separated for burial. Find these membranes on the REB web-site under silicone membranes.
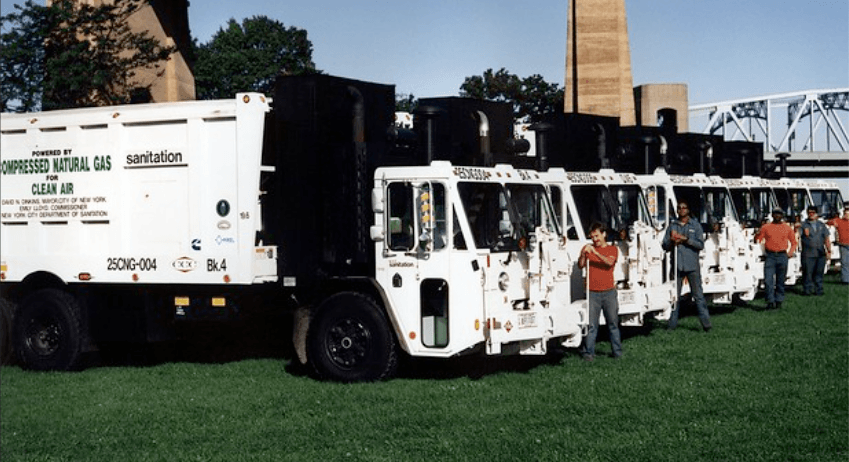
Garbage trucks in New York powered by natural gas. They could use landfill gas.
There is another gas source whose composition is nearly identical to that of landfill gas; it’s digester gas, the output of sewage digesters. I’ve written about sewage treatment mostly in terms of aerobic bio treatment, for example here, but sewage can be treated anaerobically too, and the product is virtually identical to landfill gas. I think it would be great to power garbage trucks and buses with this. Gas. In New York, currently, some garbage trucks are powered by natural gas.
As a bonus, here’s how to make methanol from partially upgraded landfill or digester gas. As a first step 2/3 of the the CO2 removed. The remained will convert to methanol. by the following overall chemistry:
3 CH4 + CO2 + 2 H2O –> 4 CH3OH.
When you removed the CO2., likely most of the water will leave with it. You add back the water as steam and heat to 800°C over Ni catalyst to make CO and H2. That’s done at about 800°C and 200 psi. Next, at lower temperature, with an appropriate catalyst you recombine the CO and H2 into methanol; with other catalysts you can make gasoline. These are not trivial processes, but they are doable on a smallish scale, and make economic sense where the methane is essentially free and there is no CNG customer. Methanol sells for $1.65/gal when sold by the tanker full, but $5 to $10/gal at the hardware store. That’s far higher than the price of methane, and methanol is far easier to ship and sell in truckload quantities.
The hope diamond resides in the Smithsonian. It really is a deep blue. It has about 5 ppm boron.
If you’ve ever seen the Hope Dimond, or a picture of it, you’ll notice a most remarkable thing: it is deep blue. While most diamonds are clear, or perhaps grey, a very few are colored. Color in diamonds is generally caused by impurities, in the case of blue diamonds, boron. The Hope diamond has about 5 ppm boron, making it a p-semiconductor. Most blue diamonds, even those just as blue, have less boron. As it turns out one of the major uses of my hydrogen purifiers hydrogen these days is in the manufacture of gem -quality, and semiconductor diamonds, some blue and some other colors. So I thought I’d write about diamonds, colored and not, natural and CVD. It’s interesting and a sort of plug for my company, REB Research.
To start off, natural diamond are formed, over centuries by the effect of high temperature and pressure on a mix of carbon and a natural catalyst mineral, Kimberlite. Diamonds formed this way are generally cubic, relatively clear, and inert, hard, highly heat conductive, and completely non-conducting of electricity. Some man made diamonds are made this way too, using high pressure presses, but gem-quality and semiconductor diamonds are generally made by chemical vapor deposition, CVD. Colored diamonds are made this way too. They have all the properties of clear diamonds, but they have controlled additions and imperfections. Add enough boron, 1000 ppm for example, and the diamond and the resulting blue diamond can conduct electricity fairly readily.
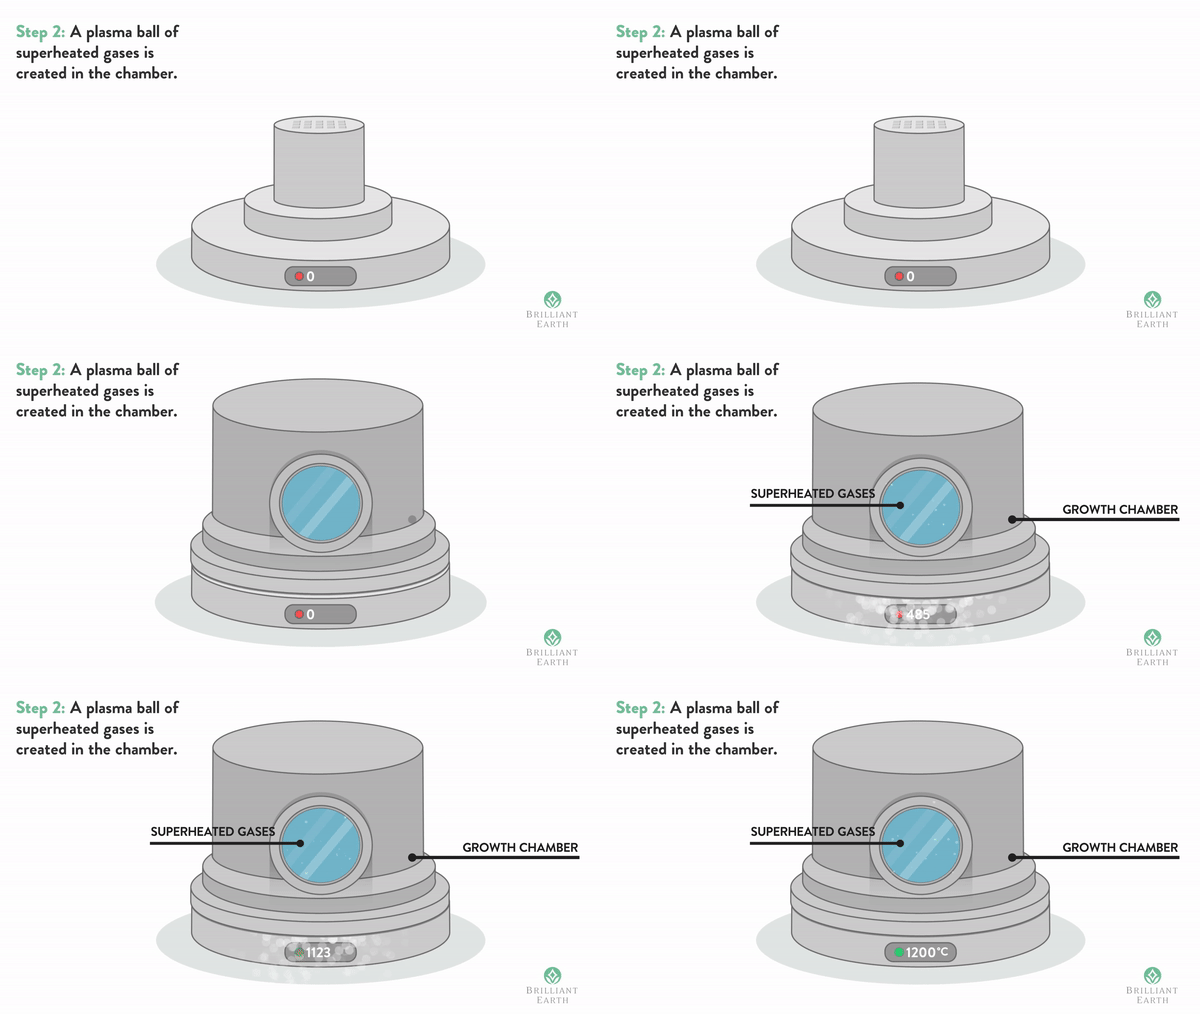
Seeds of natural diamond are placed in a diamond growth chamber and heated to about 1000°C in the presence of ionized, pure methane and hydrogen.
While natural diamond are sometimes used for technical applications, e.g. grind wheels, most technical-use diamonds are man-made by CVD, but the results tend to come out yellow. This was especially true in the early days of manufacture. CVD tends to make large, flat diamonds. This is very useful for heat sinks, and for diamond knives and manufacturers of these were among my first customers. To get a clear color, or to get high-quality colored diamonds, you need a mix of high purity methane and high purity hydrogen, and you need to avoid impurities of silica and the like from the diamond chamber. CVD is also used to make blue-conductive diamonds that can be used as semiconductors or electrodes. The process is show in the gif above from “brilliantearth”.
Multicolored diamonds made by CVD with many different dopants and treatments.
To make a CVD diamond, you place 15 to 30 seed- diamonds into a vacuum growth chamber with a flow of methane and hydrogen in ratio of 1:100 about. You heat the gas to about 1000°C (900-1200°C) , while ionizing the gas using microwaves or a hot wire. The diamonds grow epitaxially over the course of several days or weeks. Ionized hydrogen keeps the surface active, while preventing it from becoming carbonized — turning to graphite. If there isn’t enough hydrogen, you get grey, weak diamonds. If the gas isn’t pure, you get inclusions that make them appear yellow or brown. Nitrogen-impure diamonds are n-semiconductors, with a band gap greater than with boron-blue diamonds, 0.5-1 volts more. Because of this difference, nitrogen-impure diamonds absorb blue or green light, making them appear yellow, while blue diamonds absorb red light, making them blue. (This is different from the reason the sky is blue, explained here.) The difference in energy, also makes yellow diamonds poor electrical conductors. Natural, nitrogen-impure diamonds fluoresce blue or green, as one might expect, but yellow diamonds made by CVD fluoresce at longer wavelengths, reddish (I don’t know why).
The blue moon diamond, it is about as blue as the hope diamond though it has only 0.36 ppm of boron.
To make a higher-quality, yellow, n-type CVD diamonds, use very pure hydrogen. Bright yellow and green color is added by use of ppm-quantities of sulfur or phosphorus. Radiation damage also can be used to add color. Some CVD diamond makers use heat treatment to modify the color and reduce the amount of red fluorescence. CVD pink and purple diamonds are made by hydrogen doping, perhaps followed by heat treatment. The details are proprietary secrets.
Orange-red phosphorescence in the blue moon diamond.
Two major differences help experts distinguish between natural and man-made diamonds. One of these is the fluorescence, Most natural diamonds don’t fluoresce at all, and the ones that do (about 25%) fluoresce blue or green. Almost all CVD diamonds fluoresce orange-red because of nitrogen impurities that absorb blue lights. If you use very pure, nitrogen-free hydrogen, you get clear diamonds avoid much of the fluorescence and yellow. That’s why diamond folks come to us for hydrogen purifiers (and generators). There is a problem with blue diamonds, in that both natural and CVD-absorb and emit red light (that’s why they appear blue). Fortunately for diamond dealers, there is a slight difference in the red emission spectrum between natural and CVD blue diamonds. The natural ones show a mix of red and blue-green. Synthetic diamonds glow only red, typically at 660 nm.
Blue diamonds would be expected to fluoresce red, but instead they show a delayed red fluorescence called phosphorescence. That is to say, when exposed to light, they glow red and continue to glow for 10-30 seconds after the light is turned off. The decay time varies quite a lot, presumably due to differences in the n and p sites.
Natural diamond photographed between polarizers show patterns that radiate from impurities.
Natural and CVD also look different when placed between crossed polarizers. Natural diamonds show multiple direction stress bands, as at left, often radiating from inclusions. CVD diamonds show fine-grained patterns or none at all (they are not made under stress), and man-made, compression diamonds show an X-pattern that matches the press-design, or no pattern at all. If you are interested in hydrogen purifiers, or pure hydrogen generators, for this or any other purposes, please consider REB Research. If you are interested in buying a CVD diamond, there are many for sale, even from deBeers.
Robert Buxbaum, October 19, 2020. The Hope diamond was worn by three French kings, by at least one British king, and by Miss Piggy. A CVD version can be worn by you.


 is
is  and
and  can be understood as an attraction force between molecules and a molecular volume respectively. Alternately, they can be calculated from the