Category Archives: Business

Near-Poisson statistics: how many police – firemen for a small city?

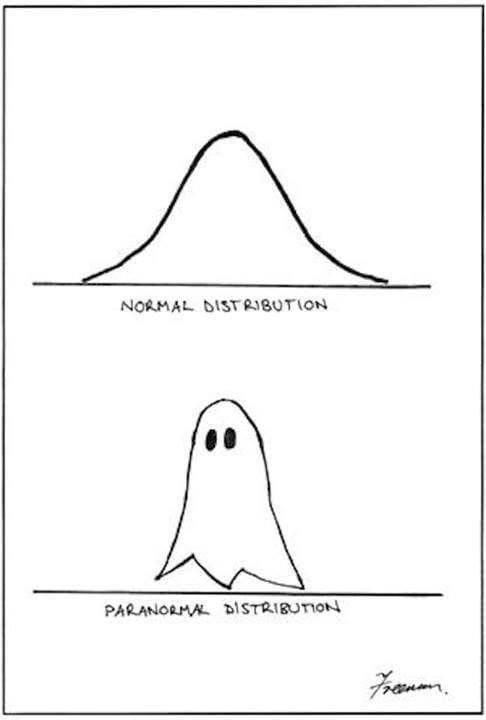
In a previous post, I dealt with the nearly-normal statistics of common things, like river crests, and explained why 100 year floods come more often than once every hundred years. As is not uncommon, the data was sort-of like a normal distribution, but deviated at the tail (the fantastic tail of the abnormal distribution). But now I’d like to present my take on a sort of statistics that (I think) should be used for the common problem of uncommon events: car crashes, fires, epidemics, wars…

Normally the mathematics used for these processes is Poisson statistics, and occasionally exponential statistics. I think these approaches lead to incorrect conclusions when applied to real-world cases of interest, e.g. choosing the size of a police force or fire department of a small town that rarely sees any crime or fire. This is relevant to Oak Park Michigan (where I live). I’ll show you how it’s treated by Poisson, and will then suggest a simpler way that’s more relevant.

First, consider an idealized version of Oak Park, Michigan (a semi-true version until the 1980s): the town had a small police department and a small fire department that saw only occasional crimes or fires, all of which required only 2 or 4 people respectively. Lets imagine that the likelihood of having one small fire at a given time is x = 5%, and that of having a violent crime is y =5% (it was 6% in 2011). A police department will need to have to have 2 policemen on call at all times, but will want 4 on the 0.25% chance that there are two simultaneous crimes (.05 x .05 = .0025); the fire department will want 8 souls on call at all times for the same reason. Either department will use the other 95% of their officers dealing with training, paperwork, investigations of less-immediate cases, care of equipment, and visiting schools, but this number on call is needed for immediate response. As there are 8760 hours per year and the police and fire workers only work 2000 hours, you’ll need at least 4.4 times this many officers. We’ll add some more for administration and sick-day relief, and predict a total staff of 20 police and 40 firemen. This is, more or less, what it was in the 1980s.

If each fire or violent crime took 3 hours (1/8 of a day), you’ll find that the entire on-call staff was busy 7.3 times per year (8x365x.0025 = 7.3), or a bit more since there is likely a seasonal effect, and since fires and violent crimes don’t fall into neat time slots. Having 3 fires or violent crimes simultaneously was very rare — and for those rare times, you could call on nearby communities, or do triage.

In response to austerity (towns always overspend in the good times, and come up short later), Oak Park realized it could use fewer employees if they combined the police and fire departments into an entity renamed “Public safety.” With 45-55 employees assigned to combined police / fire duty they’d still be able to handle the few violent crimes and fires. The sum of these events occurs 10% of the time, and we can apply the sort of statistics above to suggest that about 91% of the time there will be neither a fire nor violent crime; about 9% of the time there will be one or more fires or violent crimes (there is a 5% chance for each, but also a chance that 2 happen simultaneously). At least two events will occur 0.9% of the time (2 fires, 2 crimes or one of each), and they will have 3 or more events .09% of the time, or twice per year. The combined force allowed fewer responders since it was only rarely that 4 events happened simultaneously, and some of those were 4 crimes or 3 crimes and a fire — events that needed fewer responders. Your only real worry was when you have 3 fires, something that should happen every 3 years, or so, an acceptable risk at the time.

Before going to what caused this model of police and fire service to break down as Oak Park got bigger, I should explain Poisson statistics, exponential Statistics, and Power Law/ Fractal Statistics. The only type of statistics taught for dealing with crime like this is Poisson statistics, a type that works well when the events happen so suddenly and pass so briefly that we can claim to be interested in only how often we will see multiples of them in a period of time. The Poisson distribution formula is, P = rke/r! where P is the Probability of having some number of events, r is the total number of events divided by the total number of periods, and k is the number of events we are interested in.

Using the data above for a period-time of 3 hours, we can say that r= .1, and the likelihood of zero, one, or two events begin in the 3 hour period is 90.4%, 9.04% and 0.45%. These numbers are reasonable in terms of when events happen, but they are irrelevant to the problem anyone is really interested in: what resources are needed to come to the aid of the victims. That’s the problem with Poisson statistics: it treats something that no one cares about (when the thing start), and under-predicts the important things, like how often you’ll have multiple events in-progress. For 4 events, Poisson statistics predicts it happens only .00037% of the time — true enough, but irrelevant in terms of how often multiple teams are needed out on the job. We need four teams no matter if the 4 events began in a single 3 hour period or in close succession in two adjoining periods. The events take time to deal with, and the time overlaps.

The way I’d dealt with these events, above, suggests a power law approach. In this case, each likelihood was 1/10 the previous, and the probability P = .9 x10-k . This is called power law statistics. I’ve never seen it taught, though it appears very briefly in Wikipedia. Those who like math can re-write the above relation as log10P = log10 .9 -k.

One can generalize the above so that, for example, the decay rate can be 1/8 and not 1/10 (that is the chance of having k+1 events is 1/8 that of having k events). In this case, we could say that P = 7/8 x 8-k , or more generally that log10P = log10 A –kβ. Here k is the number of teams required at any time, β is a free variable, and Α = 1-10 because the sum of all probabilities has to equal 100%.

In college math, when behaviors like this appear, they are incorrectly translated into differential form to create “exponential statistics.” One begins by saying ∂P/∂k = -βP, where β = .9 as before, or remains some free-floating term. Everything looks fine until we integrate and set the total to 100%. We find that P = 1/λ e-kλ for k ≥ 0. This looks the same as before except that the pre-exponential always comes out wrong. In the above, the chance of having 0 events turns out to be 111%. Exponential statistics has the advantage (or disadvantage) that we find a non-zero possibility of having 1/100 of a fire, or 3.14159 crimes at a given time. We assign excessive likelihoods for fractional events and end up predicting artificially low likelihoods for the discrete events we are interested in except going away from a calculus that assumes continuity in a world where there is none. Discrete math is better than calculus here.

I now wish to generalize the power law statistics, to something similar but more robust. I’ll call my development fractal statistics (there’s already a section called fractal statistics on Wikipedia, but it’s really power-law statistics; mine will be different). Fractals were championed by Benoit B. Mandelbrot (who’s middle initial, according to the old joke, stood for Benoit B. Mandelbrot). Many random processes look fractal, e.g. the stock market. Before going here, I’d like to recall that the motivation for all this is figuring out how many people to hire for a police /fire force; we are not interested in any other irrelevant factoid, like how many calls of a certain type come in during a period of time.

To choose the size of the force, lets estimate how many times per year some number of people are needed simultaneously now that the city has bigger buildings and is seeing a few larger fires, and crimes. Lets assume that the larger fires and crimes occur only .05% of the time but might require 15 officers or more. Being prepared for even one event of this size will require expanding the force to about 80 men; 50% more than we have today, but we find that this expansion isn’t enough to cover the 0.0025% of the time when we will have two such major events simultaneously. That would require a 160 man fire-squad, and we still could not deal with two major fires and a simultaneous assault, or with a strike, or a lot of people who take sick at the same time. 

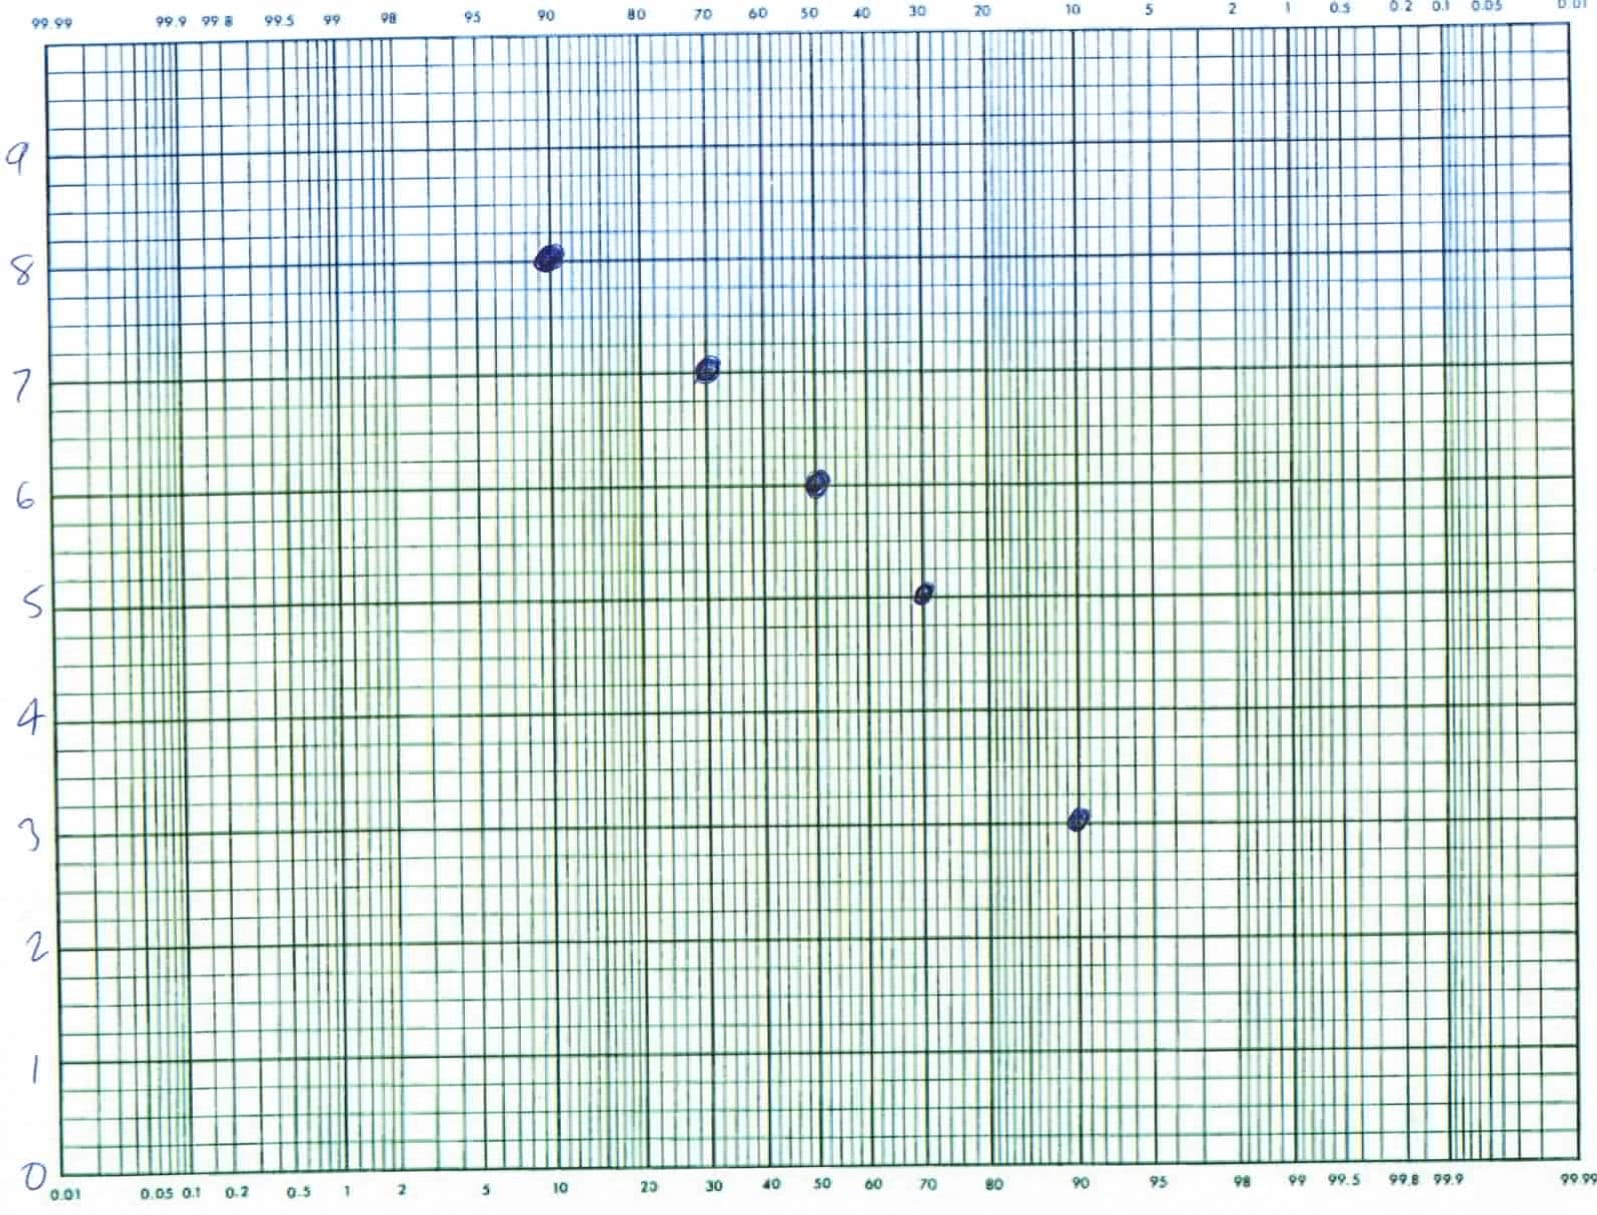
To treat this situation mathematically, we’ll say that the number times per year where a certain number of people are need, relates to the number of people based on a simple modification of the power law statistics. Thus:  log10N = A – βθ  where A and β are constants, N is the number of times per year that some number of officers are needed, and θ is the number of officers needed. To solve for the constants, plot the experimental values on a semi-log scale, and find the best straight line: -β is the slope and A  is the intercept. If the line is really straight, you are now done, and I would say that the fractal order is 1. But from the above discussion, I don’t expect this line to be straight. Rather I expect it to curve upward at high θ: there will be a tail where you require a higher number of officers. One might be tempted to modify the above by adding a term like but this will cause problems at very high θ. Thus, I’d suggest a fractal fix.

My fractal modification of the equation above is the following: log10N = A-βθ-w where A and β are similar to the power law coefficients and w is the fractal order of the decay, a coefficient that I expect to be slightly less than 1. To solve for the coefficients, pick a value of w, and find the best fits for A and β as before. The right value of w is the one that results in the straightest line fit. The equation above does not look like anything I’ve seen quite, or anything like the one shown in Wikipedia under the heading of fractal statistics, but I believe it to be correct — or at least useful.

To treat this politically is more difficult than treating it mathematically. I suspect we will have to combine our police and fire department with those of surrounding towns, and this will likely require our city to revert to a pure police department and a pure fire department. We can’t expect other cities specialists to work with our generalists particularly well. It may also mean payments to other cities, plus (perhaps) standardizing salaries and staffing. This should save money for Oak Park and should provide better service as specialists tend to do their jobs better than generalists (they also tend to be safer). But the change goes against the desire (need) of our local politicians to hand out favors of money and jobs to their friends. Keeping a non-specialized force costs lives as well as money but that doesn’t mean we’re likely to change soon.

Robert E. Buxbaum  December 6, 2013. My two previous posts are on how to climb a ladder safely, and on the relationship between mustaches in WWII: mustache men do things, and those with similar mustache styles get along best.

A Masculinist History of the Modern World, pt. 1: Beards

Most people who’ve been in university are familiar with feminist historical analysis: the history of the world as a long process of women’s empowerment. I thought there was a need for a masculinist history of the world, too, and as this was no-shave November, I thought it should focus on the importance of face hair in the modern world. I’d like to focus this post on the importance of beards, particularly in the rise of communism and of the Republican party. I note that all the early communists and Republicans were bearded. More-so, the only bearded US presidents have been Republicans, and that their main enemies from Boss Tweed, to Castro to Ho Chi Minh, have all been bearded too. I note too, that communism and the Republican party have flourished and stagnated along with the size of their beards, with a mustache interlude of the early to mid 20th century. I’ll shave that for my next post.

Marxism and the Republican Party started at about the same time, bearded. They then grew in parallel, with each presenting a face of bold, rugged, machismo, fighting the smooth tongues and chins of the Democrats and of Victorian society,and both favoring extending the franchise to women and the oppressed through the 1800s against opposition from weak-wristed, feminine liberalism.

Marx and Engles (middle) wrote the Communist Manifesto in 1848, the same year that Lincoln joined the new Republican Party, and the same year that saw Louis Napoleon (right) elected in France. The communists both wear full bards, but there is something not-quite sincere in the face hair at right and left.

Marx and Engels (middle) wrote the Communist Manifesto in 1848, the same year that Lincoln joined the new Republican Party, and the same year that saw Louis Napoleon (right) elected in France. The communists both wear full bards, but there is something not-quite sincere in the face hair at right and left.

Karl Marx (above, center left, not Groucho, left) founded the Communist League with Friedrich Engels, center right, in 1847 and wrote the communist manifesto a year later, in 1848. In 1848, too, Louis Napoleon would be elected, and the same year 1848 the anti-slavery free-soil party formed, made up of Whigs and Democrats who opposed extending slavery to the free soil of the western US. By 1856 the Free soils party had collapsed, along with the communist league. The core of the free soils formed the anti-slavery Republican party and chose as their candidate, bearded explorer John C. Fremont under the motto, “Free soil, free silver, free men.” For the next century, virtually all Republican presidential candidates would have face hair.

Lincoln the Whig had no beard -- he was the western representative of the party of Eastern elites. Lincoln the Republican grew whiskers. He was a log-cabin frontiersman, rail -splitter.

Lincoln, the Whig, had no beard — he was the western representative of the party of eastern elites. Lincoln, the Republican, grew whiskers. He was now a log-cabin frontiersman, rail-splitter.

In Europe, revolution was in the air: the battle of the barricades against clean-chined, Louis Napoleon. Marx (Karl) writes his first political economic work, the Critique of Political Economy, in 1857 presenting a theory of freedom by work value. The political economic solution of slavery: abolish property. Lincoln debates Douglas and begins a run for president while still clean-shaven. While Mr. Lincoln did not know about Karl Marx, Marx knew about Lincoln. In the 1850s and 60s he was employed as a correspondent  for the International Herald Tribune, writing about American politics, in particular about the American struggle with slavery and inflation/ deflation cycles.

William Jennings Bryan, 3 time Democrat presidential candidate, opponent of alcohol, evolution, and face hair.

William Jennings Bryan was three-times the Democratic presidential candidate; more often than anyone else. He opposed alcohol, gambling, big banks, intervention abroad, monopoly business, teaching evolution, and gold — but he supported the KKK, and unlike most Democrats, women’s suffrage.

As time passed, bearded frontier Republicans would fight against the corruption of Tammany Hall, and the offense to freedom presented by prohibition, anti industry sentiment, and anti gambling laws. Against them, clean-shaven Democrat elites could claim they were only trying to take care of a weak-willed population that needed their help. The Communists would gain power in Russia, China, and Vietnam fighting against elites too, not only in their own countries but American and British elites who (they felt) were keeping them down by a sort of mommy imperialism.

In the US, moderate Republicans (with mustaches) would try to show a gentler side to this imperialism, while fighting against Democrat isolationism. Mustached Communists would also present a gentler imperialism by helping communist candidates in Europe, Cuba, and the far east. But each was heading toward a synthesis of ideas. The republicans embraced (eventually) the minimum wage and social security. Communists embraced (eventually) some limited amount of capitalism as a way to fight starvation. In my life-time, the Republicans could win elections by claiming to fight communism, and communists could brand Republicans as “crazy war-mongers”, but the bureaucrats running things were more alike than different. When the bureaucrats sat down together, it was as in Animal Farm, you could look from one to the other and hardly see any difference.

The history of Communism seen as a decline in face hair. The long march from the beard to the bare.

The history of Communism seen as a decline in face hair. The long march from the beard to the bare. From rugged individualism to mommy state socialism. Where do we go from here?

Today both movements provide just the barest opposition to the Democratic Party in the US, and to bureaucratic socialism in China and the former Soviet Union. All politicians oppose alcohol, drugs, and gambling, at least officially; all oppose laser faire, monopoly business and the gold standard in favor of government created competition and (semi-controlled) inflation. All oppose wide-open immigration, and interventionism (the Republicans and Communists a little less). Whoever is in power, it seems the beardless, mommy conservatism of William Jennings Bryan has won. Most people are happy with the state providing our needs, and protecting our morals. is this to be the permanent state of the world? There is no obvious opposition to the mommy state. But without opposition won’t these socialist elites become more and more oppressive? I propose a bold answer, not one cut from the old cloth; the old paradigms are dead. The new opposition must sprout from the bare chin that is the new normal. Behold the new breed of beard.

The future opposition must grow from the barren ground of the new normal.

The future opposition must grow from the barren ground of the new normal. Another random thought on the political implications of no-shave November.

by Robert E. Buxbaum, No Shave, November 15, 2013. Keep watch for part 2 in this horrible (tongue in) cheek series: World War 2: Big mustache vs little mustache. See also: Roosevelt: a man, a moose, a mustache, and The surrealism of Salvador: man on a mustache.

Ab Normal Statistics and joke

The normal distribution of observation data looks sort of like a ghost. A Distribution  that really looks like a ghost is scary.

The normal distribution of observation data looks sort of like a ghost. A Distribution that really looks like a ghost is scary.

It’s funny because …. the normal distribution curve looks sort-of like a ghost. It’s also funny because it would be possible to imagine data being distributed like the ghost, and most people would be totally clue-less as to how to deal with data like that — abnormal statistics. They’d find it scary and would likely try to ignore the problem. When faced with a statistics problem, most people just hope that the data is normal; they then use standard mathematical methods with a calculator or simulation package and hope for the best.

Take the following example: you’re interested in buying a house near a river. You’d like to analyze river flood data to know your risks. How high will the river rise in 100 years, or 1000. Or perhaps you would like to analyze wind data to know how strong to make a sculpture so it does not blow down. Your first thought is to use the normal distribution math in your college statistics book. This looks awfully daunting (it doesn’t have to) and may be wrong, but it’s all you’ve got.

The normal distribution graph is considered normal, in part, because it’s fairly common to find that measured data deviates from the average in this way. Also, this distribution can be derived from the mathematics of an idealized view of the world, where any variety derives from multiple small errors around a common norm, and not from some single, giant issue. It’s not clear this is a realistic assumption in most cases, but it is comforting. I’ll show you how to do the common math as it’s normally done, and then how to do it better and quicker with no math at all, and without those assumptions.

Lets say you want to know the hundred-year maximum flood-height of a river near your house. You don’t want to wait 100 years, so you measure the maximum flood height every year over five years, say, and use statistics. Lets say you measure 8 foot, 6 foot, 3 foot (a draught year), 5 feet, and 7 feet.

The “normal” approach (pardon the pun), is to take a quick look at the data, and see that it is sort-of normal (many people don’t bother). One now takes the average, calculated here as (8+6+3+5+7)/5 = 5.8 feet. About half the times the flood waters should be higher than this (a good researcher would check this, many do not). You now calculate the standard deviation for your data, a measure of the width of the ghost, generally using a spreadsheet. The formula for standard deviation of a sample is s = √{[(8-5.8)2 + (6-5.8)2 + (3-5.8)2 + (5-5.8)2 + (7-5.8)2]/4} = 1.92. The use of 4 here in the denominator instead of 5 is called the Brussels correction – it refers to the fact that a standard of deviation is meaningless if there is only one data point.

For normal data, the one hundred year maximum height of the river (the 1% maximum) is the average height plus 2.2 times the deviation; in this case, 5.8 + 2.2 x 1.92 = 10.0 feet. If your house is any higher than this you should expect few troubles in a century. But is this confidence warranted? You could build on stilts or further from the river, but you don’t want to go too far. How far is too far?

So let’s do this better. We can, with less math, through the use of probability paper. As with any good science we begin with data, not assumptions, like that the data is normal. Arrange the river height data in a list from highest to lowest (or lowest to highest), and plot the values in this order on your probability paper as shown below. That is on paper where likelihoods from .01% to 99.99% are arranged along the bottom — x axis, and your other numbers, in this case the river heights, are the y values listed at the left. Graph paper of this sort is sold in university book stores; you can also get jpeg versions on line, but they don’t look as nice.

probability plot of maximum river height over 5 years -- looks reasonably normal, but slightly ghost-like.

Probability plot of the maximum river height over 5 years. If the data suggests a straight line, like here the data is reasonably normal. Extrapolating to 99% suggests the 100 year flood height would be 9.5 to 10.2 feet, and that it is 99.99% unlikely to reach 11 feet. That’s once in 10,000 years, other things being equal.

For the x axis values of the 5 data points above, I’ve taken the likelihood to be the middle of its percentile. Since there are 5 data points, each point is taken to represent its own 20 percentile; the middles appear at 10%, 30%, 50%, etc. I’ve plotted the highest value (8 feet) at the 10% point on the x axis, that being the middle of the upper 20%. I then plotted the second highest (7 feet) at 30%, the middle of the second 20%; the third, 6 ft at 50%; the fourth at 70%; and the draught year maximum (3 feet) at 90%.  When done, I judge if a reasonably straight line would describe the data. In this case, a line through the data looks reasonably straight, suggesting a fairly normal distribution of river heights. I notice that, if anything the heights drop off at the left suggesting that really high river levels are less likely than normal. The points will also have to drop off at the right since a negative river height is impossible. Thus my river heights describe a version of the ghost distribution in the cartoon above. This is a welcome finding since it suggests that really high flood levels are unlikely. If the data were non-normal, curving the other way we’d want to build our house higher than a normal distribution would suggest. 

You can now find the 100 year flood height from the graph above without going through any the math. Just draw your best line through the data, and look where it crosses the 1% value on your graph (that’s two major lines from the left in the graph above — you may have to expand your view to see the little 1% at top). My extrapolation suggests the hundred-year flood maximum will be somewhere between about 9.5 feet, and 10.2 feet, depending on how I choose my line. This prediction is a little lower than we calculated above, and was done graphically, without the need for a spreadsheet or math. What’s more, our predictions is more accurate, since we were in a position to evaluate the normality of the data and thus able to fit the extrapolation line accordingly. There are several ways to handle extreme curvature in the line, but all involve fitting the curve some way. Most weather data is curved, e.g. normal against a fractal, I think, and this affects you predictions. You might expect to have an ice age in 10,000 years.

The standard deviation we calculated above is related to a quality standard called six sigma — something you may have heard of. If we had a lot of parts we were making, for example, we might expect to find that the size deviation varies from a target according to a normal distribution. We call this variation σ, the greek version of s. If your production is such that the upper spec is 2.2 standard deviations from the norm, 99% of your product will be within spec; good, but not great. If you’ve got six sigmas there is one-in-a-billion confidence of meeting the spec, other things being equal. Some companies (like Starbucks) aim for this low variation, a six sigma confidence of being within spec. That is, they aim for total product uniformity in the belief that uniformity is the same as quality. There are several problems with this thinking, in my opinion. The average is rarely an optimum, and you want to have a rational theory for acceptable variation boundaries. Still, uniformity is a popular metric in quality management, and companies that use it are better off than those that do nothing. At REB Research, we like to employ the quality methods of W. Edwards Deming; we assume non-normality and aim for an optimum (that’s subject matter for a further essay). If you want help with statistics, or a quality engineering project, contact us.

I’ve also meant to write about the phrase “other things being equal”, Ceteris paribus in Latin. All this math only makes sense so long as the general parameters don’t change much. Your home won’t flood so long as they don’t build a new mall up river from you with runoff in the river, and so long as the dam doesn’t break. If these are concerns (and they should be) you still need to use statistics and probability paper, but you will now have to use other data, like on the likelihood of malls going up, or of dams breaking. When you input this other data, you will find the probability curve is not normal, but typically has a long tail (when the dam breaks, the water goes up by a lot). That’s outside of standard statistic analysis, but why those hundred year floods come a lot more often than once in 100 years. I’ve noticed that, even at Starbucks, more than 1/1,000,000,000 cups of coffee come out wrong. Even in analyzing a common snafu like this, you still use probability paper, though. It may be ‘situation normal”, but the distribution curve it describes has an abnormal tail.

by Dr. Robert E. Buxbaum, November 6, 2013. This is my second statistics post/ joke, by the way. The first one dealt with bombs on airplanes — well, take a look.

An Aesthetic of Mechanical Strength

Back when I taught materials science to chemical engineers, I used the following except of a poem to teach an aesthetic for good design, at least as concerns mechanical strength:

“…The secret to design, as the parson explained, is that the weakest part must withstand the strain. And if that part is to withstand the test, then it must be made as strong as all the rest….” (by R.E. Buxbaum, based on “The Wonderful, One-hoss Shay, by Oliver Wendell Holmes, 1858).

I figured that students needed an idea they could remember of what good design looked like. I wanted them to realize that there is always a weakest part in any device or process, and that this is the likely point of failure. Good design accepts this truth and designs everything around it. You make sure that the device will fail at a part or time of your choosing, and that, when it fails (not if), it’s preferably at at time and place where you can repair it easily and cheaply (a fuse, or a door hinge), and that doesn’t cause too much mayhem when it fails. Once this failure part is chosen and in place, I taught that the rest should be stronger, but there is no point in making any other part vastly stronger than your weakest link. Thus for example, once you’ve decided to use a fuse that fails at a certain amperage, there is no point in choosing wiring to take more than 2-3 times the amperage of the fuse.

This is an aesthetic argument, of course, but it’s important for a person to know what good work looks like (to me, and perhaps to the student). An engineer needs a positive view of craftwork beyond compliments from the boss or grades from me. Some day, I’ll be gone, and the boss won’t be looking. Only self-esteem keeps you going.

Many engineering aspects relate to failure points. If you don’t know what the failure point is, make a prototype and test it to failure. Then, if you don’t like what you see, remodel accordingly. If you like the point of failure but decide you really want to make the device stronger or more robust, be aware that this may involve more than strengthening that part only. You may need to re-engineer the entire chain of parts so they are as failure resistant as this part.

I also wanted to teach that there are many failure chains to look out for: many ways that things can wrong beyond breaking. Check for failure by fire, melting, explosion, smell, shock, rust, and even color change. Color change should not be ignored, BTW; there are many products that people won’t use as soon as they look bad (cars, for example). Make sure that each failure chain has it’s own, known weak links. In a car, the paint should fade, chip, or peel before the metal underneath starts rusting or sagging (at least that’s my aesthetic). And in the DuPont gun-powder mill below, one wall should be weaker so that the walls blow outward the right way (away from traffic). Be aware that human error is the most common failure mode: design should be acceptably idiot-proof.

Dupont powder mills had a thinner wall and a stronger wall so that, if there were an explosion it would blow out towards the river. This mill has a second wall to protect workers. The thinner wall should be barely strong enough to stand up to wind and rain; the stronger walls should stand up to explosions that blow out the other wall.

Dupont powder mills had a thinner wall and a stronger wall so that, if there were an explosion, it would blow out ‘safely.’ This mill has a second wall to protect workers. The thinner wall must be strong enough to stand up to wind and rain; the stronger walls should stand up to all likely explosions.

Related to my aesthetic of mechanical strength, I tried to teach an aesthetic of cost, weight, appearance, and green-soundness: Choose materials that are cheaper, rather than more expensive and that weigh less rather than more. Use materials that look better if you’ve the choice, and use recyclable materials. These all derive from the well-known axiom, omit needless stuff. Or, as William of Occam put it, “Entia non sunt multiplicanda sine necessitate.” As an aside, I’ve found that, when engineers use Latin, we sound smarter: “lingua bona lingua motua est.” (a good language is a dead language) — it’s the same with quoting dead 19th century poets. Dead 19th century poets are far better than undead ones, but I digress.

Use of recyclable materials gets you out of lots of problems relative to materials that must be disposed of. E.g. if you use aluminum insulation (recyclable) instead of ceramic fiber, you will have an easier time getting rid of the scrap. As a result, you are not as likely to expose your workers (or you) to mesothelioma, or similar disease. You should not have to pay someone to haul away excess or damaged product; a scraper will oblige, and he may even pay you for it if you have enough. Recycling helps cash flow with decommissioning too, when money is tight. It’s better to find your $1 worth of scrap is now worth $2 instead of discovering that your $1 worth of garbage now costs $2 to haul away. By the way, most heat loss is from black body radiation, so aluminum foil may actually work better than ceramics of the same thermal conductivity.

Buildings can be recycled too. Buy them and sell them as needed. Shipping containers make for great lab buildings because they are cheap, strong, and movable. You can sell them off-site when you’re done. We have a shipping container lab building, and a shipping container storage building — both worth more now than when I bought them. They are also rather attractive with our advertising on them — attractive according to my design aesthetic. Here’s an insight into why chemical engineers earn more than chemists; and insight into the difference between mechanical engineering and civil engineering. Here’s an architecture aesthetic. Here’s one about the scientific method.

Robert E. Buxbaum, October 31, 2013

Why random experimental design is better

In a previous post I claimed that, to do good research, you want to arrange experiments so there is no pre-hypothesis of how the results will turn out. As the post was long, I said nothing direct on how such experiments should be organized, but only alluded to my preference: experiments should be organized at randomly chosen conditions within the area of interest. The alternative, shown below is that experiments should be done at the cardinal points in the space, or at corner extremes: the Wilson Box and Taguchi design of experiments (DoE), respectively. Doing experiments at these points implies a sort of expectation of the outcome; generally that results will be linearly, orthogonal related to causes; in such cases, the extreme values are the most telling. Sorry to say, this usually isn’t how experimental data will fall out. First experimental test points according to a Wilson Box, a Taguchi, and a random experimental design. The Wilson box and Taguchi are OK choices if you know or suspect that there are no significant non-linear interactions, and where experiments can be done at these extreme points. Random is the way nature works; and I suspect that's best -- it's certainly easiest.

First experimental test points according to a Wilson Box, a Taguchi, and a random experimental design. The Wilson box and Taguchi are OK choices if you know or suspect that there are no significant non-linear interactions, and where experiments can be done at these extreme points. Random is the way nature works; and I suspect that’s best — it’s certainly easiest.

The first test-points for experiments according to the Wilson Box method and Taguchi method of experimental designs are shown on the left and center of the figure above, along with a randomly chosen set of experimental conditions on the right. Taguchi experiments are the most popular choice nowadays, especially in Japan, but as Taguchi himself points out, this approach works best if there are “few interactions between variables, and if only a few variables contribute significantly.” Wilson Box experimental choices help if there is a parabolic effect from at least one parameter, but are fairly unsuited to cases with strong cross-interactions.

Perhaps the main problems with doing experiments at extreme or cardinal points is that these experiments are usually harder than at random points, and that the results from these difficult tests generally tell you nothing you didn’t know or suspect from the start. The minimum concentration is usually zero, and the minimum temperature is usually one where reactions are too slow to matter. When you test at the minimum-minimum point, you expect to find nothing, and generally that’s what you find. In the data sets shown above, it will not be uncommon that the two minimum W-B data points, and the 3 minimum Taguchi data points, will show no measurable result at all.

Randomly selected experimental conditions are the experimental equivalent of Monte Carlo simulation, and is the method evolution uses. Set out the space of possible compositions, morphologies and test conditions as with the other method, and perhaps plot them on graph paper. Now, toss darts at the paper to pick a few compositions and sets of conditions to test; and do a few experiments. Because nature is rarely linear, you are likely to find better results and more interesting phenomena than at any of those at the extremes. After the first few experiments, when you think you understand how things work, you can pick experimental points that target an optimum extreme point, or that visit a more-interesting or representative survey of the possibilities. In any case, you’ll quickly get a sense of how things work, and how successful the experimental program will be. If nothing works at all, you may want to cancel the program early, if things work really well you’ll want to expand it. With random experimental points you do fewer worthless experiments, and you can easily increase or decrease the number of experiments in the program as funding and time allows.

Consider the simple case of choosing a composition for gunpowder. The composition itself involves only 3 or 4 components, but there is also morphology to consider including the gross structure and fine structure (degree of grinding). Instead of picking experiments at the maximum compositions: 100% salt-peter, 0% salt-peter, grinding to sub-micron size, etc., as with Taguchi, a random methodology is to pick random, easily do-able conditions: 20% S and 40% salt-peter, say. These compositions will be easier to ignite, and the results are likely to be more relevant to the project goals.

The advantages of random testing get bigger the more variables and levels you need to test. Testing 9 variables at 3 levels each takes 27 Taguchi points, but only 16 or so if the experimental points are randomly chosen. To test if the behavior is linear, you can use the results from your first 7 or 8 randomly chosen experiments, derive the vector that gives the steepest improvement in n-dimensional space (a weighted sum of all the improvement vectors), and then do another experimental point that’s as far along in the direction of that vector as you think reasonable. If your result at this point is better than at any point you’ve visited, you’re well on your way to determining the conditions of optimal operation. That’s a lot faster than by starting with 27 hard-to-do experiments. What’s more, if you don’t find an optimum; congratulate yourself, you’ve just discovered an non-linear behavior; something that would be easy to overlook with Taguchi or Wilson Box methodologies.

The basic idea is one Sherlock Holmes pointed out (Study in Scarlet): It is a capital mistake to theorize before one has data. Insensibly one begins to twist facts to suit theories, instead of theories to suit facts.” (Case of Identity). Life is infinitely stranger than anything which the mind of man could invent.

Robert E. Buxbaum, September 11, 2013. A nice description of the Wilson Box method is presented in Perry’s Handbook (6th ed). SInce I had trouble finding a free, on-line description, I linked to a paper by someone using it to test ingredient choices in baked bread. Here’s a link for more info about random experimental choice, from the University of Michigan, Chemical Engineering dept. Here’s a joke on the misuse of statistics, and a link regarding the Taguchi Methodology. Finally, here’s a pointless joke on irrational numbers, that I posted for pi-day.

Detroit Teachers are not paid too much

Detroit is bankrupt financially, but not because the public education teachers have negotiated rich contracts. If anything Detroit teachers are paid too little given the hardship of their work. The education problem in Detroit, I think, is with the quality of education, and of life. Parents leave Detroit, if they can afford it; students who can’t leave the city avoid the Detroit system by transferring to private schools, by commuting to schools in the suburbs, or by staying home. Fewer than half of Detroit students are in the Detroit public schools.

The average salary for a public school teacher in Detroit is (2013) $51,000 per year. That’s 3% less than the national average and $3,020/year less than the Michigan average. While some Detroit teachers are paid over $100,000 per year, a factoid that angers some on the right, that’s a minority of teachers, only those with advanced degrees and many years of seniority. For every one of these, the Detroit system has several assistant teachers, substitute teachers, and early childhood teachers earning $20,000 to $25,000/ year. That’s an awfully low salary given their education and the danger and difficulty of their work. It’s less than janitors are paid on an annual basis (janitors work more hours generally). This is a city with 25 times the murder rate in the rest of the state. If anything, good teachers deserve a higher salary.

Detroit public schools provide among the worst math education in the US. In 2009, showing the lowest math proficiency scores ever recorded in the 21-year history of the national math proficiency test. Attendance and graduation are low too: Friday attendance averages 71.2%, and is never as high as 80% on any day. The high-school graduation rate in Detroit is only 29.4%. Interested parents have responded by shifting their children out of the Detroit system at the rate of 8000/year. Currently, less than half of school age children go to Detroit public schools (51,070 last year); 50,076 go to charter schools, some 9,500 go to schools in the suburbs, and 8,783, those in the 5% in worst-performing schools, are now educated by the state reform district.

Outside a state run reform district school, The state has taken over the 5% worst performing schools.

The state of Michigan has taken over the 5% worst performing schools in Detroit through their “Reform District” system. They provide supplies and emphasize job-skills.

Poor attendance and the departure of interested students makes it hard for any teacher to handle a class. Teachers must try to teach responsibility to kids who don’t show up, in a high crime setting, with only a crooked city council to look up to. This is a city council that oversaw decades of “pay for play,” where you had to bribe the elected officials to bid on projects. Even among officials who don’t directly steal, there is a pattern of giving themselves and their families fancy cars or gambling trips to Canada using taxpayers dollars. The mayor awarded Cadillac Escaldes to his family and friends, and had a 22-man team of police to protect him. On this environment, a teacher has to be a real hero to achieve even modest results.

Student departure means there a surfeit of teachers and schools, but it is hard to see what to do. You’d like to reassign teachers who are on the payroll, but doing little, and fire the worst teachers. Sorry to say, it’s hard to fire anyone, and it’s hard to figure out which are the bad teachers; just because your class can’t read doesn’t mean you are a bad teacher. Recently a teacher of the year was fired because the evaluation formula gave her a low rating.

Making changes involves upending union seniority rules. Further, there is an Americans with Disability Act that protects older teachers, along with the lazy, the thief, and the drug addict — assuming they claim disability by frailty, poor upbringing or mental disease. To speed change along, I would like to see the elected education board replaced by an appointed board with the power to act quickly and the responsibility to deliver quality education within the current budget. Unlike the present system, there must be oversight to keep them from using the money on themselves.

She state could take over more schools into the reform school district, or they could remove entire school districts from Detroit incorporation and make them Michigan townships. A Michigan township has more flexibility in how they run schools, police, and other services. They can run as many schools as they want, and can contract with their neighbors or independent suppliers for the rest. A city has to provide schools for everyone who’s not opted out. Detroit’s population density already matches that of rural areas; rural management might benefit some communities.

I would like to see the curriculum modified to be more financially relevant. Detroit schools could reinstate classes in shop and trade-skills. In effect that’s what’s done at Detroit’s magnet schools, e.g. the Cass Academy and the Edison Academy. It’s also the heart of several charter schools in the state-run reform district. Shop class teaches math, an important basis of science, and responsibility. If your project looks worse than your neighbor’s, you can only blame yourself, not the system. And if you take home your work, there is that reward for doing a good job. As a very last thought, I’d like to see teachers paid more than janitors; this means that the current wage structure has to change. If nothing else, a change would show that there is a monetary value in education.

Robert Buxbaum, August 16, 2013; I live outside Detroit, in one of the school districts that students go to when they flee the city.

Slowing Cancer with Fish and Unhealth Food

Some 25 years ago, while still a chemical engineering professor at Michigan State University, I did some statistical work for a group in the Physiology department on the relationship between diet and cancer. The research involved giving cancer to groups of rats and feeding them different diets of the same calorie intake to see which promoted or slowed the disease. It had been determined that low-calorie diets slowed cancer growth, and were good for longevity in general, while overweight rats died young (true in humans too, by the way, though there’s a limit and starvation will kill you).

The group found that fish oil was generally good for you, but they found that there were several unhealthy foods that slowed cancer growth in rats. The statistics were clouded by the fact that cancer growth rates are not normally distributed, and I was brought in to help untangle the observations.

With help from probability paper (a favorite trick of mine), I confirmed that healthy rats fared better on healthily diets, but cancerous rats did better with some unhealth food. Sick or well, all rats did best with fish oil, and all rats did pretty well with olive oil, but the cancerous rats did better with lard or palm oil (normally an unhealthy diet) and very poorly with corn oil or canola, oils that are normally healthful. The results are published in several articles in the journals “Cancer” and “Cancer Research.”

Among vitamins, they found something similar (it was before I joined the group). Several anti-oxidizing vitamins, A, D and E made things worse for carcinogenic rats while being good for healthy rats (and for people in moderation). Moderation is key; too much of a good thing isn’t good, and a diet with too much fish oil promotes cancer.

What seems to be happening is that the cancer cells grow at the same rate with all of the equi-caloric diets, but that there was a difference the rate of natural cancer cell death. More cancer cells died when the rat was fed junk food oils than those fed a diet of corn oil and canola. Similarly, the reason anti-oxidizing vitamins hurt cancerous rats was that fewer cancer cells died when the rats were fed these vitamins. A working hypothesis is that the junk oils (and the fish oil) produced free radicals that did more damage to the cancer than to the rats. In healthy rats (and people), these free radicals are bad, promoting cell mutation, cell degradation, and sometimes cancer. But perhaps our body use these same free radicals to fight disease.

Larger amounts of vitamins A, D, and E hurt cancerous-rats by removing the free radicals they normally use fight the disease, or so our model went. Bad oils and fish-oil in moderation, with calorie intake held constant, helped slow the cancer, by a presumed mechanism of adding a few more free radicals. Fish oil, it can be assumed, killed some healthy cells in the healthy rats too, but not enough to cause problems when taken in moderation. Even healthy people are often benefitted by poisons like sunlight, coffee, alcohol and radiation.

At this point, a warning is in-order: Don’t rely on fish oil and lard as home remedies if you’ve got cancer. Rats are not people, and your calorie intake is not held artificially constant with no other treatments given. Get treated by a real doctor — he or she will use radiation and/ or real drugs, and those will form the right amount of free radicals, targeted to the right places. Our rats were given massive amounts of cancer and had no other treatment besides diet. Excess vitamin A has been shown to be bad for humans under treatment for lung cancer, and that’s perhaps because of the mechanism we imagine, or perhaps everything works by some other mechanism. However it works, a little fish in your diet is probably a good idea whether you are sick or well.

A simpler health trick is that it couldn’t hurt most Americans is a lower calorie diet, especially if combined with exercise. Dr. Mites, a colleague of mine in the department (now deceased at 90+) liked to say that, if exercise could be put into a pill, it would be the most prescribed drug in America. There are few things that would benefit most Americans more than (moderate) exercise. There was a sign in the physiology office, perhaps his doing, “If it’s physical, it’s therapy.”

Anyway these are some useful things I learned as an associate professor in the physiology department at Michigan State. I ended up writing 30-35 physiology papers, e.g. on how cells crawl and cell regulation through architecture; and I met a lot of cool people. Perhaps I’ll blog more about health, biology, the body, or about non-normal statistics and probability paper. Please tell me what you’re interested in, or give me some keen insights of your own.

Dr. Robert Buxbaum is a Chemical Engineer who mostly works in hydrogen I’ve published some 75 technical papers, including two each in Science and Nature: fancy magazines that you’d normally have to pay for, but this blog is free. August 14, 2013

Crime: US vs UK and Canada

The US has a lot of guns and a lot of murders compared to England, Canada, and most of Europe. This is something Piers Morgan likes to point out to Americans who then struggle to defend the wisdom of gun ownership and the 2nd Amendment: “How do you justify 4.8 murders/year per 100,000 population when there are only 1.6/year per 100,000 in Canada, 1.2/year per 100,000 in the UK, and 1.0/year per 100,000 in Australia — countries with few murders and tough anti-gun laws?,” he asks. What Piers doesn’t mention, is that these anti-gun countries have far higher contact crime (assault) rates than the US, see below.

Contact Crime Per Country

Contact crime rates for 17 industrialized countries. From the Dutch Ministry of Justice. click here for details about the survey and a breakdown of crimes.

The differences narrow somewhat when considering most violent crimes, but we still have far fewer than Canada and the UK. Canada has 963/year per 100,000 “most violent crimes,” while the US has 420/year per 100,000. “Most violent crimes” here are counted as: “murder and non-negligent manslaughter,” “forcible rape,” “robbery,” and “aggravated assault” (FBI values). England and Wales classify crimes somewhat differently, but have about two times the US rate, 775/year per 100,000, if “most violent crimes” are defined as: “violence against the person, with injury,” “most serious sexual crime,” and “robbery.”

It is possible that the presence of guns protects Americans from general crime while making murder more common, but it’s also possible that gun ownership is a murder deterrent too. Our murder rate is 1/5 that of Mexico, 1/4 that of Brazil, and 1/3 that of Russia; all countries with strong anti-gun laws but a violent populous. Perhaps the US (Texan) penchant for guns is what keeps Mexican gangs on their, gun-control side of the border. Then again, it’s possible that guns neither increase nor decrease murder rates, so that changing our laws would not have any major effect. Switzerland (a country with famously high gun ownership) has far fewer murders than the US and about 1/2 the rate of the UK: 0.7 murders/ year per 100,000. Japan, a country with low gun ownership has hardly any crime of any sort — not even littering. As in the zen buddhist joke, change comes from within.

Homicide rate per country

Homicide rate per country

One major theory for US violence was that drugs and poverty were the causes. Remove these by stricter anti-drug laws and government welfare, and the violent crime would go away. Sorry to say, it has not happened; worse yet, murder rates are highest in cities like Detroit where welfare is a way of life, and where a fairly high fraction of the population is in prison for drugs.

I suspect that our welfare payments have hurt Detroit as much as they’ve helped, and that Detroit’s higher living wage, has made it hard for people to find honest work. Stiff drug penalties have not helped Detroit either, and may contribute to making crimes more violent. As Thomas More pointed out in the 1500s, if you are going to prison for many years for a small crime, you’re more likely to use force to avoid risk capture. Perhaps penalties would work better if they were smaller.

Charity can help a city, i think, and so can good architecture. I’m on the board of two charities that try to do positive things, and I plant trees in Detroit (sometimes).

R. E. Buxbaum, July 10, 2013. To make money, I sell hydrogen generators: stuff I invented, mostly.

Escher Architecture – joke?

Caption will say where this is from.

Robert  Leighton, from the New Yorker,

Is funny because …. there’s an Escher-like impossible structure and a dirty word (ass, tee hee). Besides that, this joke highlights a fundamental conflict between the architect and the client (customer): what is good architecture?

Typically the customer whats a home or office that “looks nice”, “doesn’t cost too much”, and “works,” perhaps as an advertisement for the company. Often the architect wants to make a statement for him/herself, or wants to produce a work of art. Left to their own, architects can produce expensive monuments that no one can live in.

A wonderful (horrible) case concerns The Cooper Union, my alma mater, and more-or-less the only free college in America. The Cooper Union was founded by an inventive mechanic, Peter Cooper, see my biography, who invented jello, and rolled steel, laid the transatlantic cable, founded AT&T, and managed to give free education to a century and a half of students. The trustees of the school tore down the old, serviceable building, sold the land, and built a $270,000,000 dollar monstrosity. Hailed by the New York Times as great architecture, it bankrupted the school, and is unusable for the sort of hands-on education that Peter Cooper devised.

In hopes of attracting a rich donor, Cooper Union borrowed $175 million to erect this grotesque building for its engineering department. No donor materialized, and, as a result, the school’s 155-year-old policy of free tuition has vaporized.

In hopes of attracting a rich donor, Cooper Union sold its engineering building and borrowed $175 million to erect this replacement. No donor materialized, and, with it, a 155-year-old policy of free tuition.

Here’s a surrealist jokean engineer joke, and a thought on control engineering. Here too is a  sculpture I put on top of my building; the eyes follow you.

R.E. Buxbaum, July 8, 2013; I do consulting on hydrogen, and my company makes hydrogen products.

Chemist v Chemical Engineer joke

What’s the difference between a chemist and a chemical engineer?

How much they make.

I made up this joke up as there were no other chemical engineer jokes I knew. It’s an OK double entente that’s pretty true — both in terms of product produced and the amount of salary (there’s probably a cause-and-effect relation here). Typical of these puns, this joke ignores the internal differences in methodologies and background (see my post, How is Chemical engineering?). If you like, here’s another engineering joke,  a chemistry joke, and a dwarf joke.

R.E. Buxbaum –  June 28, 2013.