Hydrogen permeation rates in Inconel, Hastelloy and stainless steels.

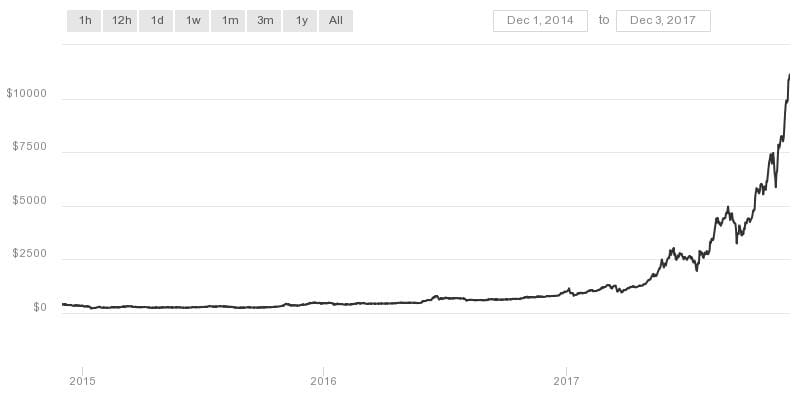
Some 20 years ago, I published a graph of the permeation rate for hydrogen in several metals at low pressure, See the graph here, but I didn’t include stainless steel in the graph.

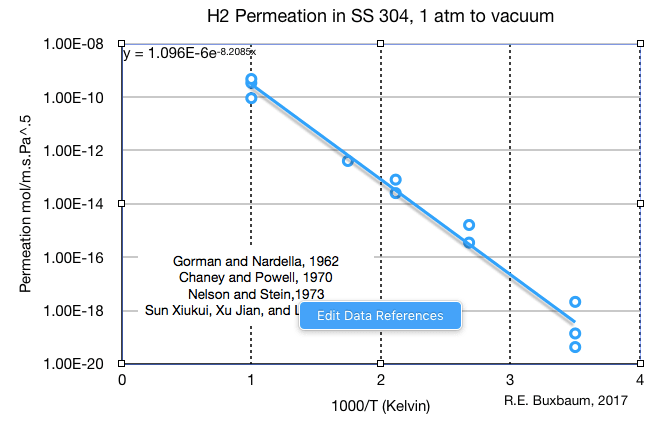
Hydrogen permeation in clean SS-304; four research groups’ data.

One reason I did not include stainless steel was there were many stainless steels and the hydrogen permeation rates were different, especially so between austenitic (FCC) steels and ferritic steels (BCC). Another issue was oxidation. All stainless steels are oxidized, and it affect H2 permeation a lot. You can decrease the hydrogen permeation rate significantly by oxidation, or by surface nitriding, etc (my company will even provide this service). Yet another issue is cold work. When  an austenitic stainless steel is worked — rolled or drawn — some Austinite (FCC) material transforms to Martisite (a sort of stretched BCC). Even a small amount of martisite causes an order of magnitude difference in the permeation rate, as shown below. For better or worse, after 20 years, I’m now ready to address H2 in stainless steel, or as ready as I’m likely to be.

Hydrogen permeation data for SS 340 and SS 321.

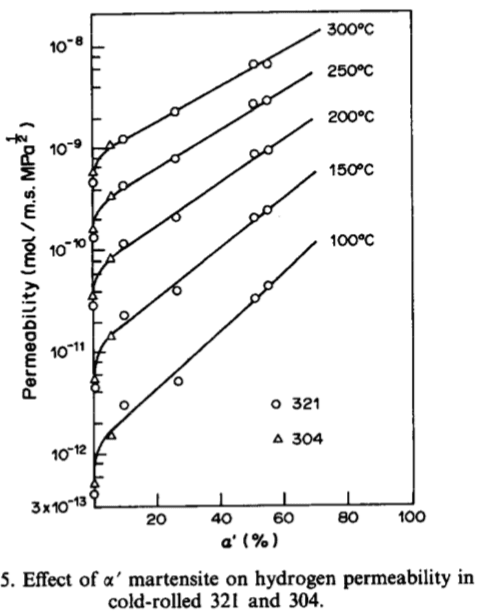
Hydrogen permeation in SS 340 and SS 321. Cold work affects H2 permeation more than the difference between 304 and 321; Sun Xiukui, Xu Jian, and Li Yiyi, 1989

The first graph I’d like to present, above, is a combination of four research groups’ data for hydrogen transport in clean SS 304, the most common stainless steel in use today. SS 304 is a ductile, austenitic (FCC), work hardening, steel of classic 18-8 composition (18% Cr, 8% Ni). It shares the same basic composition with SS 316, SS 321 and 304L only differing in minor components. The data from four research groups shows a lot of scatter: a factor of 5 variation at high temperature, 1000 K (727 °C), and almost two orders of magnitude variation (factor of 50) at room temperature, 13°C. Pressure is not a factor in creating the scatter, as all of these studies were done with 1 atm, 100 kPa hydrogen transporting to vacuum.

The two likely reasons for the variation are differences in the oxide coat, and differences in the amount of cold work. It is possible these are the same explanation, as a martensitic phase might increase H2 permeation by introducing flaws into the oxide coat. As the graph at left shows, working these alloys causes more differences in H2 permeation than any difference between alloys, or at least between SS 304 and SS 321. A good equation for the permeation behavior of SS 304 is:

P (mol/m.s.Pa1/2) = 1.1 x10⁻⁶ exp (-8200/T).      (H2 in SS-304)

Because of the song influence of cold work and oxidation, I’m of the opinion that I get a slightly different, and better equation if I add in permeation data from three other 18-8 stainless steels:

P (mol/m.s.Pa1/2) = 4.75 x10-7 exp (-7880/T).     (H2 in annealed SS-304, SS-316, SS-321)

Screen Shot 2017-12-16 at 10.37.37 PM

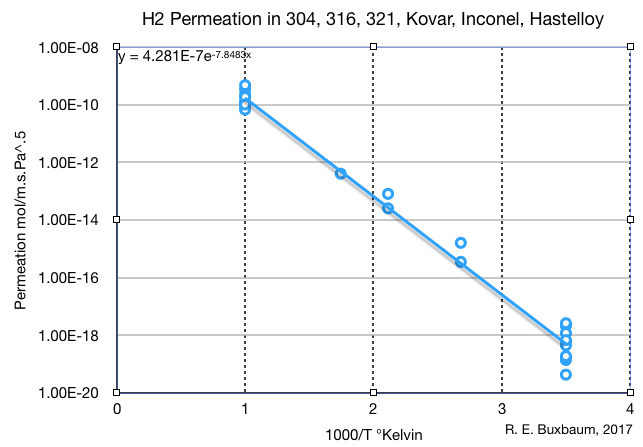
Hydrogen permeation through several common stainless steels, as well as Inocnel and Hastelloy

Though this result is about half of the previous at high temperature, I would trust it better, at least for annealed SS-304, and also for any annealed austenitic stainless steel. Just as an experiment, I decided to add a few nickel and cobalt alloys to the mix, and chose to add data for inconel 600, 625, and 718; for kovar; for Hastelloy, and for Fe-5%Si-5%Ge, and SS4130. At left, I pilot all of these on one graph along with data for the common stainless steels. To my eyes the scatter in the H2 permeation rates is indistinguishable from that SS 304 above or in the mixed 18-8 steels (data not shown). Including these materials to the plot decreases the standard deviation a bit to a factor of 2 at 1000°K and a factor of 4 at 13°C. Making a least-square analysis of the data, I find the following equation for permeation in all common FCC stainless steels, plus Inconels, Hastelloys and Kovar:

P (mol/m.s.Pa1/2) = 4.3 x10⁻⁷ exp (-7850/T).

This equation is near-identical to the equation above for mixed, 18-8 stainless steel. I would trust it for annealed or low carbon metal (SS-304L) to a factor of 2 accuracy at high temperatures, or a factor of 4 at low temperatures. Low carbon reduces the tendency to form Martinsite. You can not use any of these equations for hydrogen in ferritic (BCC) alloys as the rates are different, but this is as good as you’re likely to get for basic austenitc stainless and related materials. If you are interested in the effect of cold work, here is a good reference. If you are bothered by the square-root of pressure driving force, it’s a result of entropy: hydrogen travels in stainless steel as dislocated H atoms and the dissociation H2 –> 2 H leads to the square root.

Robert Buxbaum, December 17, 2017. My business, REB Research, makes hydrogen generators and purifiers; we sell getters; we consult on hydrogen-related issues, and will (if you like) provide oxide (and similar) permeation barriers.

Change home air filters 3 times per year

Energy efficient furnaces use a surprisingly large amount of electricity to blow the air around your house. Part of the problem is the pressure drop of the ducts, but quite a lot of energy is lost bowing air through the dust filter. An energy-saving idea: replace the filter on your furnace twice a year or more. Another idea, you don’t have to use the fanciest of filters. Dirty filters provide a lot of back-pressure especially when they are dirty.

I built a water manometer, see diagram below to measure the pressure drop through my furnace filters. The pressure drop is measured from the difference in the height of the water column shown. Each inch of water is 0.04 psi or 275 Pa. Using this pressure difference and the flow rating of the furnace, I calculated the amount of power lost by the following formula:

W = Q ∆P/ µ.

Here W is the amount of power use, Watts, Q is flow rate m3/s, ∆P = the pressure drop in Pa, and µ is the efficiency of the motor and blower, typically about 50%.

With clean filters (two different brands), I measured 1/8″ and 1/4″ of water column, or a pressure drop of 0.005 and 0.01 psi, depending on the filter. The “better the filter”, that is the higher the MERV rating, the higher the pressure drop. I also measured the pressure drop through a 6 month old filter and found it to be 1/2″ of water, or 0.02 psi or 140 Pa. Multiplying this by the amount of air moved, 1000 cfm =  25 m3 per minute or 0.42 m3/s, and dividing by the efficiency, I calculate a power use of 118 W. That is 0.118 kWh/hr. or 2.8 kWh/day.

water manometer used to measure pressure drop through the filter of my furnace. I stuck two copper tubes into the furnace, and attached a plastic hose. Pressure was measured from the difference in the water level in the hose.

The water manometer I used to measure the pressure drop through the filter of my furnace. I stuck two copper tubes into the furnace, and attached a plastic tube half filled with water between the copper tubes. Pressure was measured from the difference in the water level in the plastic tube. Each 1″ of water is 280 Pa or 0.04psi.

At the above rate of power use and a cost of electricity of 11¢/kWhr, I find it would cost me an extra 4 KWhr or about 31¢/day to pump air through my dirty-ish filter; that’s $113/year. The cost through a clean filter would be about half this, suggesting that for every year of filter use I spend an average of $57t where t is the use life of the filter.

To calculate the ideal time to change filters I set up the following formula for the total cost per year $, including cost per year spent on filters (at $5/ filter), and the pressure-induced electric cost:

$ = 5/t + 57 t.

The shorter the life of the filter, t, the more I spend on filters, but the less on electricity. I now use calculus to find the filter life that produces the minimum $, and determine that $ is a minimum at a filter life t = √5/57 = .30 years.  The upshot, then, if you filters are like mine, you should change your three times a year, or so; every 3.6 months to be super-exact. For what it’s worth, I buy MERV 5 filters at Ace or Home Depot. If I bought more expensive filters, the optimal change time would likely be once or twice per year. I figure that, unless you are very allergic or make electronics in your basement you don’t need a filter with MERV rating higher than 8 or so.

I’ve mentioned in a previous essay/post that dust starts out mostly as dead skin cells. Over time dust mites eat the skin, some pretty nasty stuff. Most folks are allergic to the mites, but I’m not convinced that the filter on your furnace dies much to isolate you from them since the mites, etc tend to hang out in your bed and clothes (a charming thought, I know).

Old fashioned, octopus furnace. Free convection.

Old fashioned, octopus furnace. Free convection.

The previous house I had, had no filter on the furnace (and no blower). I noticed no difference in my tendency to cough or itch. That furnace relied for circulation on the tendency for hot air to rise. That is, “free convection” circulated air through the home and furnace by way of “Octopus” ducts. If you wonder what a furnace like that looks like here’s a picture.

I calculate that a 10 foot column of air that is 30°C warmer than that in a house will have a buoyancy of about 0.00055 psi (1/8″ of water). That’s enough pressure to drive circulation through my home, and might have even driven air through a clean, low MERV dust filter. The furnace didn’t use any more gas than a modern furnace would, as best I could tell, since I was able to adjust the damper easily (I could see the flame). It used no electricity except for the thermostat control, and the overall cost was lower than for my current, high-efficiency furnace with its electrical blower and forced convection.

Robert E. Buxbaum, December 7, 2017. I ran for water commissioner, and post occasional energy-saving or water saving ideas. Another good energy saver is curtains. And here are some ideas on water-saving, and on toilet paper.

Bitcoin risks, uses, and bubble

Bitcoin prices over the last 3 years

Bitcoin prices over the last 3 years

As I write this, the price of a single bitcoin is approximately $11,100 yesterday, up some 2000% in the last 6 months. The rise rate suggests it is a financial bubble. Or maybe it’s not: just a very risky investment suited for inclusion in a regularly balanced portfolio. These are two competing views of bitcoin, and there are two ways to distinguish between them. One is on the basis of technical analysis — does this fast rise look like a bubble (Yes!), and the other is to accept that bitcoin has a fundamental value, one I’ll calculate that below. In either case, the price rise is so fast that it is very difficult to conclude that the rise is not majorly driven by speculation: the belief that someone else will pay more later. The history of many bubbles suggests that all bubbles burst sooner or later, and that everyone holding the item loses when it does. The only winners are the brokers and the last investors who get out just before the burst. The speculator thinks that’s going to be him, while the investor uses rebalancing to get some of benefit and fun, without having to know exactly when to get out.

That bitcoin is a bubble may be seen by comparing the price three years ago. At that point it was $380 and dropping. A year later, it was $360 and rising. One can compare the price rise of the past 2-3 years with that for some famous bubbles and see that bitcoin has risen 30 times approximately, an increase that is on a path to beat them all except, perhaps, the tulip bubble of 1622.

A comparison between Bitcoin prices, and those of tulips, 1929 stocks, and other speculative bubbles; multiple of original price vs year from peak.

A comparison between Bitcoin prices, and those of tulips, 1929 stocks, and other speculative bubbles; multiple of original price vs year from peak.

That its price looks like a bubble is not to deny that bitcoin has a fundamental value. Bitcoin is nearly un-counterfeit-able, and its ownership is nearly untraceable. These are interesting properties that make bitcoin valuable mostly for illegal activity. To calculate the fundamental value of a bitcoin, it is only necessary to know the total value of bitcoin business transactions and the “speed of money.” As a first guess, lets say that all the transactions are illegal and add up to the equivalent of the GDP of Michigan, $400 billion/year. The value of a single bitcoin would be this number divided by the number of bitcoin in circulation, 15,000,000 currently, and by the “speed of money,” the number of business transactions per year per coin. I’ll take this to be 3 per year. It turns out there are 5 bitcoin transactions total per year per coin, but 2/5 of that, I’ll assume, are investment transactions. Based on this, a single bitcoin should be worth about $8890, slightly below its current valuation. The gross speed number, 5/year, includes bitcoin transactions that are investments and never traded for goods, and those actively being used in smuggling, drug-deals, etc.

If the bitcoin trade will grow to $600 billion year in a year with no other change, the price rise of a single coin would surpass that of Dutch tulip bulbs except that more coins are bing minted, and that the speed is increasing. If you assume that coin use will reach $1,600 billion/year, the GDP of Texas in the semi-near future, before the Feds jump in, the fundamental value of a coin should grow no higher than $44,000 or so. There are several problems for bitcoin investors who are betting on this. One is that the Feds are unlikely to tolerate so large an unregulated, illegal economy. Another is that bitcoin transactions are not likely to go totally legal. It is very hard (near impossible) to connect a bitcoin to its owner. This is a plus for someone trying to deal in drugs or trying hide profits from the IRS (or his spouse), but a legal merchant will want the protection of courts of law. For this, he or she needs to demonstrate ownership of the item being traded, and that is not available with bitcoin. The lack of a solid, legitimate business need suggests to me that the FBI will likely sweep in sooner or later, and that the value of a coin will never reach $44,000.

Yet another problem for those wishing to invest in bitcoin is the existence of more bitcoins (undiscovered, or un-mined so far) and the existence of other cryptocurrencies with the same general qualities: Litecoin (LTC), Ethereum (ETH), and Zcash (ZEC) as examples. The existence of these coins increases the divisor one should use when calculating the value of a bitcoin. The total number of bitcoins is capped at 21,000,000, that is 6,000,000 coins more than known today. Assuming more use and more acceptance, the speed (turnovers per year) is likely to increase to four or five, similar to that of other currencies. Let’s assume that the bitcoin will control 1 trillion dollars per year of a $1.6 trillion/year illegal market. One can now calculate the maximum long term target price of a bitcoin by dividing $1 trillion/year by the number of bitcoins, 21,000,000, and by the speed of commercial use, 4.5/year. This suggests a maximum fundamental value of $10,582 per coin. This is just about the current price. Let the investment buyer beware.

For an amusing, though not helpful read into the price: here are Bill Gates, Warren Buffet, Charlie Munger, and Noam Chomsky discussing Bitcoin.

Robert Buxbaum, December 3, 2017.

How to tell a genius from a nut.

In my time in college, as a student, grad student, and professor, I ran into quite a few geniuses and quite a few weirdos. Most of the geniuses were weird, but most of the weirdos were not geniuses. Many geniuses drank or smoked pot, most drunks and stoners were stupid, paranoids. My problem was finding a reasonably quick way to tell the geniuses from the nuts; tell Einsteins from I’m-stoned.kennedy thought

Only quick way I found is by their friends. If someone’s friends are dullards, chances are they are too. Related to this is humility. Most real geniuses have a body of humility that can extent to extreme self-doubt. They are aware of what they don’t know, and are generally used to skepticism and having to defend their ideas. A genius will do so enthusiastically, happy to have someone listen; a non genius will bristle at tough questions, responding by bluster, bragging, name dropping, and insult. A science genius will do math, and will show you interesting math stuff just for fun, a nut will not. Nuts will use big words will have few friends you’d want to hang with. A real genius uses simple words.

Another tell, those with real knowledge are knowledgeable on what others think (there’s actually a study on this). That is, they are able to speak in the mind-set of others, pointing out the logic of the other side, and practical differences where the other side would be right. There should be a clear reason to come on one side or the other, and not just a scream of frustration that you don’t agree. The ability to see the world through others’ eyes is not a proof they are right — some visionary geniuses have been boors, but it is a tell. Besides boors are no fun to be with; they are worth avoiding if possible.

education test treeAnd what of folks who are good to talk to; decent, loyal, humble, and fun, but turn out to be not-geniuses. I’d suggest looking a little closer. At the worst, these are good friends, boon companions, and decent citizens — far more enjoyable to deal with than the boors. But if you look closer, you may find a genius in a different area — a plumbing genius, or a police genius, or a short-order cook genius. One of my some-time employees is a bouncer-genius. He works as a bouncer and has the remarkable ability to quite people down, or throw them out, without causing a fight — it’s not an easy skill. In my political work trying to become drain commissioner, I ran into a sewage genius, perhaps two. These are hard-working people that I learn from.

People make the mistake of equating genius with academia, but that’s just a very narrow slice of genius. They then compound the mistake by looking at grades. It pays to look at results and to pay respects accordingly. To quote an old joke/ story: what do you call the fellow who graduated at the bottom of his medical school class? “Doctor” He or she is a doctor. And what do you call the fellow who graduated at the bottom of his law school class? “your honor.”

Robert Buxbaum, November 27, 2017.

Why Warren Buffett pays 0% social security tax

Social Security is billed along with Medicare (health care for the poor) as an anti-flat tax called FICA where middle class workers pay 7.65 -15.3%, and rich people pay essentially 0%. The reason that Warren Buffet and other rich people pay 0%, on a percentage basis, far less than their secretaries, is that there is a FICA cap of $127,200 currently, and he earns far more than $127,200. Buffett’s secretaries pays 7.65%, or which 6% approximately is social-security payment, and the rest Medicare. Buffett’s company then matches the 7.65% — a situation that applies to virtually every employee in the US.

A self employed person though, a gardener say, pays both the employee and employer portion or 15.3%. The same $127,200 cap applies, but since few gardeners make more than this amount, they are likely to pay 15.3% on all earnings, with no deductions. FICA really socks the poor and middle class, and barely touches a rich man like Buffett. This is the tax-inequality that most needs addressing, in my opinion, and one I have not heard discussed.

A short history of FICA

A visual history of FICA rates (right), and of the salary cap (left). Medicare contributions were added in 1966.

As I write this, there is a debate about tax reform that mostly involves income tax, but not at all FICA. Income tax could be improved, in my opinion, and should be. We could remove some exemptions that are being abused, and we should lower the general rates, especially for foreign-earnings, but the current income tax isn’t that bad, in my opinion. Buffett likes to brag about the high rate he pays, but it’s not a bad rate compared to the rest of the world. And Buffett benefits from a lot of things we don’t. His income is taxed at a lower rate than a worker’s would be since most of it is unearned. And, like most rich folks, he has exemptions and deductions that do not apply to most. He can deduct cars, private airplanes, and interest; most folks don’t deduct these things since they don’t spend enough to exceed the “standard deduction”. I’m happy to say these issues are being addressed in the current tax re-write.

The current, House version of the GOP tax proposal includes a raise in the standard deduction and a cap on interest and other deductions. There is a general decrease in the tax rate for earnings, and a decrease for earnings made abroad and repatriated. I’d like to see tariffs, too but they do not appear in the versions I’ve seen. And I’ve very much like to see a decrease in the FICA rate coupled with a removal of the salary cap. Pick a rate, 4% say, where we collect the same amount, but spread the burden uniformly. Why should 7.65%-15.3% or the workmanship wages got to the window, the orphan, and healthcare of the poor, while 0% of Buffett’s go for this?

Some other tax ideas: I’d like to see shorter criminal sentences, especially for drugs, and I’d like to see healthcare addressed to reduce the administrative burden.

Robert E. Buxbaum, November 17, 2017. In the news today, the senate version puts back the tax exemption on private jets. The opposite of progress, they say, is congress.

Penicillin, cheese allergy, and stomach cancer

penecillin molecule

The penicillin molecule is a product of the penicillin mold

Many people believe they are allergic to penicillin — it’s the most common perceived drug allergy — but several studies have shown that most folks who think they are allergic are not. Perhaps they once were, but when people who thought they were allergic were tested, virtually none showed allergic reaction. In a test of 146, presumably allergic patients at McMaster University, only two had their penicillin allergy confirmed; 98.6% of the patients tested negative. A similar study at the Mayo Clinic tested 384 pre-surgical patients with a history of penicillin allergy; 94% tested negative. They were given clearance to receive penicillin antibiotics before, during, and after surgery. Read a summary here.

08

Orange showing three different strains of the penicillin mold; some of these are toxic.

This is very good news. Penicillin is a low-cost, low side-effect antibiotic, effective against many diseases including salmonella, botulism, gonorrhea, and scarlet fever. The penicillin molecule is a common product of nature, produced by a variety of molds, e.g. on the orange at right, and in cheese. It is thus something people have been exposed to, whether they realize it or not.

Penicillin allergy is a deadly danger for the few who really are allergic, and it’s worthwhile to find out if that means you. The good news: that penicillin is found in common cheeses suggests, to me, a simple test for penicillin allergy. Anyone who suspects penicillin allergy and does not have a general dairy allergy can try eating appropriate cheese: brie, blue, camembert, or Stilton. That is any of the cheeses made with penicillin molds. If you don’t break out in a rash or suffer stomach cramps, you’re very likely not allergic to penicillin.

There is some difference between cheeses, so if you have problems with Roquefort, but not brie or camembert, there’s still a good chance you’re not allergic to penicillin. Brie and camembert have a white fuzzy mold coat of Penicillium camemberti. This mold exudes penicillin — not in enough quantity to cure gonorrhea, but enough to give taste and avoid spoilage, and enough to test for allergy. Danish blue and Roquefort, shown below, have a different look and a sharper flavor . They’re made with blue-green, Penicillium roqueforti. This mold produces penicillin, but also a small amount of neurotoxin, roquefortine C. It’s not enough to harm most people, but it could cause an allergic reaction to folks who are not allergic to penicillin. Don’t eat a moldy orange, by the way; some forms of the mold produce a lot of neurotoxin.

For people who are not allergic, a thought I had is that one could, perhaps treat heartburn or ulcers with cheese; perhaps even cancer? H-Pylori, the bacteria associated with heartburn, is effectively treated by amoxicillin, a penicillin variant. If a penicillin variant kills the bacteria, it seems plausible that penicillin cheese might too. And since amoxicillin, is found to reduce the risk of gastric cancer, it’s reasonable to expect that penicillin or penicillin cheese might be cancer-protective. To my knowledge, this has never been studied, but it seems worth considering. The other, standard treatment for heartburn, pantoprazole / Protonix, is known to cause osteoporosis, and increase the risk of cancer, and it doesn’t taste as good as cheese.

A culture of Penicillium roqueforti. Most people are not allergic to it.

The blue in blue cheese is Penicillium roqueforti. Most people are not allergic.

Penicillin was discovered by Alexander Fleming, who noticed that a single spore of the mold killed the bacteria near it on a Petrie dish. He tried to produce significant quantities of the drug from the mold with limited success, but was able to halt disease in patients, and was able to interest others who had more skill in large-scale fungus growing. Kids looking for a good science fair project, might consider penicillin growing, penicillin allergy, treatment of stomach ailments using cheese, or anything else related to the drug. Three Swedish journals declared that penicillin was the most important discovery of the last 1000 years. It would be cool if the dilute form, the one available in your supermarket, could be shown to treat heartburn and/or cancer. Another drug you could study is Lysozyme, a chemical found in tears, in saliva, and in human milk (but not in cow milk). Alexander Fleming found that tears killed bacteria, as did penicillin. Lysozyme, the active ingredient, is currently used to treat animals, but not humans.

Robert Buxbaum, November 9, 2017. Since starting work on this essay I’ve been eating blue cheese. It tastes good and seems to cure heartburn. As a personal note: my first science fair project (4th grade) involved growing molds on moistened bread. For an incubator, I used the underside of our home radiator. The location kept my mom from finding the experiment and throwing it out.

Forced diversity of race is racist

Let me browse through some thoughts on efforts to address endemic racism. I’m not sure I’ll get anywhere, but you might as well enter the laboratory of my mind on the issue.

I’d like to begin with a line of the bible (why not?) “‘Do not pervert justice; do not show partiality to the poor or favoritism to the great, but judge your neighbor fairly.” (Lev. 19:15). This sounds good, but in college admissions, I’ve found we try to do better by showing  favoritism to the descendants of those who’ve been historically left-out. This was called affirmative action, it’s now called “diversity”.  

In 1981, when I began teaching chemical engineering at Michigan State University, our department had race-based quotas to allow easier admission to the descendants of historically-disadvantaged groups. All major universities did this at the time. The claim was that it would be temporary; it continues to this day. In our case, the target was to get 15% or so black, Hispanics and American Indians students (7 in a class of 50). We achieved this target by accepting such students with a 2.0 GPA, and not requiring a math or science background; Caucasians required 3.0 minimum, and we did require math or science. I’m not sure we helped the disadvantaged by this, either personally or professionally, but we made the administration happy. The kids seemed happy too, at least for a while. The ones we got were, by and large, bright. To make up for the lack of background we offered tutoring and adjusted grades. Some diversity students did well, others didn’t. Mostly they went into HR or management after graduation, places they could have gone without our efforts.

After some years, the Supreme court ended our quota based selection, saying it was, itself racist. They said we could still reverse-discriminate for “diversity,” though. That is, if the purpose wasn’t to address previous wrongs, but to improve the class. We changed our literature, but kept our selection methods and kept the same percentage targets as before.

This is a popular meme about racism. It makes sense to me.

This is a popular meme about racism.

The only way we monitored that we met the race-percent target was by a check-box on forms. Students reported race, and we collected this, but we didn’t check that black students look black or Hispanic students spoke Spanish. There was no check on student honesty. Anyone who checked the box got the benefits. This lack of check bread cheating at MSU and elsewhere. Senator Elizabeth Warren got easy entry into Harvard and Penn, in part by claiming to be an Indian on her forms. She has no evidence of Indian blood or culture Here’s Snopes. My sense is that our methods mostly help the crooked.

The main problem with is, I suspect, is the goal. We’ve decided to make every university department match the state’s racial breakdown. It’s a pretty goal, but it doesn’t seem like one that helps students or the state. Would it help the MSU hockey squad to force to team to racially match the state; would it help the volleyball team, or the football team?  So why assume it helps every academic department to make it’s racial makeup match the state’s. Why not let talented black students head to business or management departments before graduation. They might go further without our intervention.

This is not to say there are not racial inequalities, but I suspect that these diversity programs don’t help the students, and may actually hurt. They promote crookedness, and divert student attention from achieving excellence to maintaining victim status. Any group that isn’t loud enough in claiming victim status is robbed of the reverse-discrimination that they’ve been told they need. They’re told they can’t really compete, and many come to believe it. In several universities, we gone so far as to hire “bias referees” to protect minorities from having to defend their intellectual views in open discussion. The referee robs people of the need to think, and serves, I suspect, no one but a group of powerful politicians and administrators — people you are not supposed to criticize. On that topic, here is a video of Malcolm X talking about the danger of white liberals. Clearly he can hold his own in a debate without having a bias referee, and he makes some very good points about white liberals doing more harm than good.

Robert Buxbaum, November 5, 2017. In a related problem, black folks are arrested too often. I suggest rational drug laws. Some financial training could help too.

The energy cost of airplanes, trains, and buses

I’ve come to conclude that airplane travel makes a lot more sense than high-speed trains. Consider the marginal energy cost of a 90kg (200 lb) person getting on a 737-800, the most commonly flown commercial jet in US service. For this plane, the ratio of lift/drag at cruise speed is 19, suggesting an average value of 15 or so for a 1 hr trip when you include take-off and landing. The energy cost of his trip is related to the cost of jet fuel, about $3.20/gallon, or about $1/kg. The heat energy content of jet fuel is 44 MJ/kg. Assuming an average engine efficiency of 21%, we calculate a motive-energy cost of 1.1 x 10-7 $/J. The amount of energy per mile is just force times distance. Force is the person’s weight in (in Newtons) divided by 15, the lift/drag ratio. The energy use per mile (1609 m) is 90*9.8*1609/15 = 94,600 J. Multiplying by the $-per-Joule we find the marginal cost is 1¢ per mile: virtually nothing compared to driving.

The Wright brothers testing their gliders in 1901 (left) and 1902 (right). The angle of the tether reflects the dramatic improvement in the lift-to-drag ratio.

The Wright brothers testing their gliders in 1901 (left) and 1902 (right). The angle of the tether reflects a dramatic improvement in lift-to-drag ratio; the marginal cost per mile is inversely proportional to the lift-to-drag ratio.

The marginal cost of 1¢/passenger mile explains why airplanes offer crazy-low, fares to fill seats. But this is just the marginal cost. The average energy cost is higher since it includes the weight of the plane. On a reasonably full 737 flight, the passengers and luggage  weigh about 1/4 as much as the plane and its fuel. Effectively, each passenger weighs 800 lbs, suggesting a 4¢/mile energy cost, or $20 of energy per passenger for the 500 mile flight from Detroit to NY. Though the fuel rate of burn is high, about 5000 lbs/hr, the mpg is high because of the high speed and the high number of passengers. The 737 gets somewhat more than 80 passenger miles per gallon, far less than the typical person driving — and the 747 does better yet.

The average passengers must pay more than $20 for a flight to cover wages, capital, interest, profit, taxes, and landing fees. Still, one can see how discount airlines could make money if they have a good deal with a hub airport, one that allows them low landing fees and allows them to buy fuel at near cost.

Compare this to any proposed super-fast or Mag-lev train. Over any significant distance, the plane will be cheaper, faster, and as energy-efficient. Current US passenger trains, when fairly full, boast a fuel economy of 200 passenger miles per gallon, but they are rarely full. Currently, they take some 15 hours to go Detroit to NY, in part because they go slow, and in part because they go via longer routes, visiting Toronto and Montreal in this case, with many stops along the way. With this long route, even if the train got 150 passenger mpg, the 750 mile trip would use 5 gallons per passenger, compared to 6.25 for the flight above. This is a savings of $5, at a cost of 20 hours of a passenger’s life. Even train speeds were doubled, the trip would still take 10 hours including stops, and the energy cost would be higher. As for price, beyond the costs of wages, capital, interest, profit, taxes, and depot fees, trains have to add the cost of new track and track upkeep. Wages too will be higher because the trip takes longer. While I’d be happy to see better train signaling to allow passenger trains to go 100 mph on current, freight-compatible lines, I can’t see the benefit of government-funded super-track for 150+ mph trains that will still take 10 hours and will still be half-full.

Something else removing my enthusiasm for super trains is the appearance of new short take-off and landing jets. Some years ago, I noted that Detroit’s Coleman Young airport no longer has commercial traffic because its runway was too short, 1550 m. I’m happy to report that Bombardier’s new CS100s should make small airports like this usable. A CS100 will hold 120 passengers, requires only 1509m of runway, and is quiet enough for city use. Similarly, the venerable Q-400 carries 72 passengers and requires 1425m. The economics of these planes is such that it’s hard to imagine mag-lev beating them for the proposed US high-speed train routes: Dallas to Houston; LA to San José to San Francisco; or Chicago-Detroit-Toledo-Cleveland-Pittsburgh. So far US has kept out these planes because Boeing claims unfair competition, but I trust that this is just a delay. For shorter trips, I note that modern busses are as fast and energy-efficient as trains, and far cheaper because they share the road costs with cars and trucks.

If the US does want to spend money, I’d suggest improving inner-city airports, and to improve roads for higher speed car and bus traffic. If you want low pollution transport at high efficiency, how about hydrogen hybrid buses? The range is high and the cost per passenger mile remains low because busses use very little energy per passenger mile.

Robert Buxbaum, October 30, 2017. I taught engineering for 10 years at Michigan State, and my company, REB Research, makes hydrogen generators and hydrogen purifiers.

Fat people live longer, show less dementia

Life expectancy is hardly affected by weight in the normal - overweight- obese range. BMI 30-34.9 = obese.

Life expectancy is hardly affected by weight in the normal – overweight – obese range. BMI 30-34.9 = obese.

Lets imagine you are a 5’10” man and you weigh 140 lbs. In that case, you have a BMI of 20, and you probably think you’re pretty healthy, or perhaps you think you’re a bit overweight. Our institutes of health will say that you are an “average-wight” or “normal-weight” American, and then claim that the average-weight American is overweight. What they don’t tell you, is that low weight, and so-called average weight people in the US live shorter lives. Other things being equal, the morbidity (chance of death) for a thin American, BMI 18.5 is nearly triple that of someone who’s obese, BMI 32. The morbidity of the normal-weight American is better, but is still nearly double that of the obese fellow whose BMI is 32.

Our NIH has created a crisis of overweight Americans, that is not based on health. They work hard to solve this obesity crisis by telling people to jog to work, and by creating ever-more complicated food pyramids. Those who listen live shorter lives. A prime example is Jim Fixx, author of several running books including “The complete Book of Running.” He was 52 when he died of a heart attack while running. Similar to this is the diet-expert, Adelle Davis, author of “Let’s eat right to keep fit”. She died at 70 of cancer — somewhat younger than the average American woman. She attributed her cancer to having eaten junk food as a youth. I would attribute it to being thin. Not only do thin people live shorter lives, but their chances of recovering from cancer, or living with it, seem to improve if you start with some fat.

The same patter exists where age-related dementia is concerned. If you divide the population into quartiles of weight, the heaviest has the least likelihood of dementia, the second heaviest has the second-least, the third has the third-least, and the lightest Americans have the highest likelihood of dementia. Here are two studies to that effect, “Association between late-life body mass index and dementia”, The Kame Project, Neurology. 2009 May 19; 72(20): 1741–1746. And “BMI and risk of dementia in two million people over two decades: a retrospective cohort study” The Lancet, Volume 3, No. 6, p431–436, June 2015.

Morbidity and weight, uncorrected data, and corrected by removing the demented.

Morbidity and weight, uncorrected data, and corrected by removing the demented. The likelihood of dementia decreases with weight.

Now you may think that there is a confounding, cause and effect here: that crazy old people don’t live as long. You’d be right there, crazy people don’t live as long. Still, if you correct the BMI-mortality data to remove those with dementia, you still find that in terms of life-span, for men and women, it pays to be overweight or obese but not morbidly so. The study concludes as follows: “Weight loss was related to a higher mortality risk (HR = 1.5; 95% CI: 1.2,1.9) but this association was attenuated when persons with short follow-up or persons with dementia were excluded.” As advice to those who are planning a weight loss program, you might go crazy and reduce your life-span a lot, but if you don’t go crazy, you’re only reducing your life-span a little.

In terms of health food, I’ve noticed that many non-health foods, like alcohol and chocolate are associated with longevity and mental health. And while low-impact exercise helps increase life-span, that exercise is only minimally associated with weight loss. Mostly weight loss involves changing the amount you eat and changing your clothes choices to maximize radiant heat loss.

Dr. Robert E. Buxbaum, October 26, 2017. A joke: Last week I was mugged by a vegan. You may ask how I know it was a vegan. He told be before running off with my wallet.

magnetic separation of air

As some of you will know, oxygen is paramagnetic, attracted slightly by a magnet. Oxygen’s paramagnetism is due to the two unpaired electrons in every O2 molecule. Oxygen has a triple-bond structure as discussed here (much of the chemistry you were taught is wrong). Virtually every other common gas is diamagnetic, repelled by a magnet. These include nitrogen, water, CO2, and argon — all diamagnetic. As a result, you can do a reasonable job of extracting oxygen from air by the use of a magnet. This is awfully cool, and could make for a good science fair project, if anyone is of a mind.

But first some math, or physics, if you like. To a good approximation the magnetization of a material, M = CH/T where M is magnetization, H is magnetic field strength, C is the Curie constant for the material, and T is absolute temperature.

Ignoring for now, the difference between entropy and internal energy, but thinking only in terms of work derived by lowering a magnet towards a volume of gas, we can say that the work extracted, and thus the decrease in energy of the magnetic gas is ∫∫HdM  = MH/2. At constant temperature and pressure, we can say ∆G = -CH2/2T.

The maximum magnetization you’re likely to get with any permanent magnet (not achieved to date) is about 50 Tesla, or 40,000 ampere meters. At 20°C, the per-mol, magnetic susceptibility of oxygen is 1.34×10⁻⁶  This suggests that the Curie constant is 1.34 ×10−6 x 293 = 3.93 ×10⁻⁴. Applying this value to oxygen in a 50 Tesla magnet at 20°C, we find the energy difference, ∆G is 1072 J/mole = RT ln ß where ß is a concentration ratio factor between the O2 content of the magnetized and un-magnetized gas, C1/C2 =ß

At room temperature, 298K ß = 1.6, and thus we find that the maximum oxygen concentration you’re likely to get is about 1.6 x 21% = 33%. It’s slightly more than this due to nitrogen’s diamagnetism, but this effect is too small the matter. What does matter is that 33% O2 is a good amount for a variety of medical uses.

I show below my simple design for a magnetic O2 concentrator. The dotted line is a permeable membrane of no selectivity – with a little O2 permeability the design will work better. All you need is a blower or pump. A coffee filter could serve as a membrane.bux magneitc air separator

This design is as simple as the standard membrane-based O2 concentrator – those based on semi-permeable membranes, but this design should require less pressure differential — just enough to overcome the magnet. Less pressure means the blower should be smaller, and less noisy, with less energy use.  I figure this could be really convenient for people who need portable oxygen. With current magnets it would take 4-5 stages or low temperatures to reach this concentration, still this design could have commercial use, I’d think.

On the theoretical end, an interesting thing I find concerns the effect on the entropy of the magnetic oxygen. (Please ignore this paragraph if you have not learned statistical thermodynamics.) While you might imagine that magnetization decreases entropy, other-things being equal because the molecules are somewhat aligned with the field, temperature and pressure being fixed, I’ve come to realize that entropy is likely higher. A sea of semi-aligned molecules will have a slightly higher heat capacity than nonaligned molecules because the vibrational Cp is higher, other things being equal. Thus, unless I’m wrong, the temperature of the gas will be slightly lower in the magnetic area than in the non-magnetic field area. Temperature and pressure are not the same within the separator as out, by the way; the blower is something of a compressor, though a much less-energy intense one than used for most air separators. Because of the blower, both the magnetic and the non magnetic air will be slightly warmer than in the surround (blower Work = ∆T/Cp). This heat will be mostly lost when the gas leaves the system, that is when it flows to lower pressure, both gas streams will be, essentially at room temperature. Again, this is not the case with the classic membrane-based oxygen concentrators — there the nitrogen-rich stream is notably warm.

Robert E. Buxbaum, October 11, 2017. I find thermodynamics wonderful, both as science and as an analog for society.