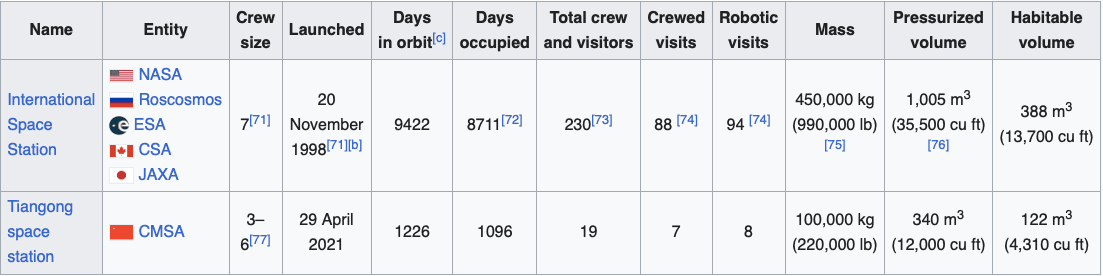
It gets so little notice from the news agencies that many will be surprised to find that China has a space station. It’s known alternately as the Tiangong Space Station or the CSS, Chinese Space Station; it’s smaller than the International Space Station, ISS, but it’s not small. Here is a visual and data comparison, both from Wikipedia.

The ISS has far more solar panels, but the power input is similar because the CSS panels are of higher efficiency. As shown in the table below, the mass of the ISS is about 4.5 times that of CSS but the habitable volume is only 3 times greater than of CSS, and the claimed crew size is similar, of 3 to 6 compared to 7. The CSS is less messy, less noisy, with less mass, and more energy efficiency. Part of the efficiency comes from that the CSS uses ion propulsion thrusters to keep the station in orbit, while the ISS uses chemical rockets. The CSS thus seems better, on paper. To some extent that’s because it’s more modern.
Another reason that the ISS is more messy is that it’s a collaboration. A major part of its mission is to develop peaceful cooperation between the US, Europe and Russia. It’s been fairly successful at this, especially in the first two decades, and part of making sure parts from The US, Russia, Europe, Japan, and Canada all work together is that many different standards must be tolerated and connected. The ISS tolerates different space suits, different capsules, different connections, and different voltages. The result is researchers communicate, and work together on science, sending joint messages of peace to the folks on earth. Peace is an intended product.
By contrast, the Chinese space station is solely Chinese. There are no interconnection issues, but also no peace dividend. It has a partially military purpose too, including operation of killer satellites, and some degree of data mining. This was banned for ISS. So far the CSS has hosted Chinese astronauts. No Chinese astronauts have visited the ISS, either.
India was asked to join the ISS, but has declined, wishing to follow China’s path of space independence. The Indian Space Research Organization plans to launch a small space station on its own, Gaganyaan, in 2025, and after that, a larger version. That’s a shame, though it’s not clear how long cooperation will continue on the ISS, either. See the movie I.S.S. (2023) for how this might play out. Currently, there is a tradition of cooperation about ISS, and it’s held despite the War in Ukraine. The various nations manage to work together in space and on the ground, launching people and materials to the ISS, and working together reliability.
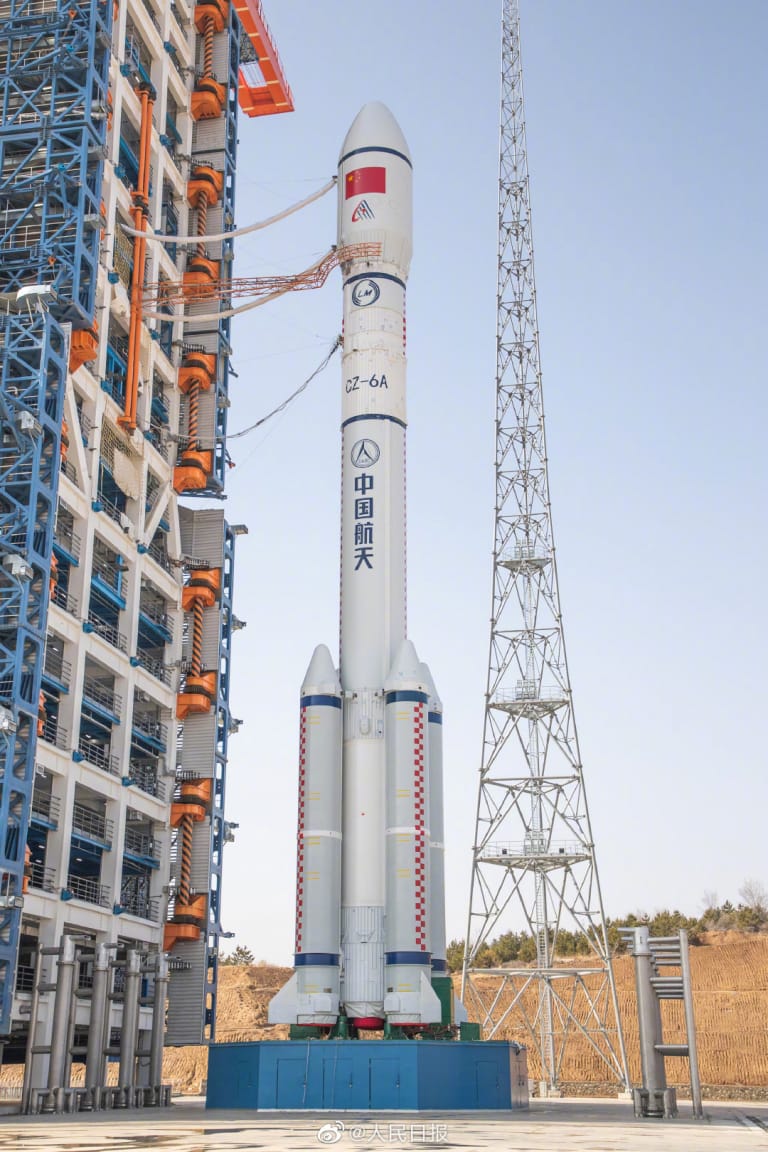
Although it isn’t a direct part of the space stations, I should mention the troubles of the Boeing Star-liner capsule that took two astronauts to the ISS compared to the apparently flawless record of the CSS. The fact is, I’m not bothered by failures, so long as we learn from them. I suspect Boeing will learn, and suspect that this and other flailing projects would be in worse shape without the ISS. Besides, the ISS has been a major catalyst in the development of SpaceX, a US success story that China seems intent on trying to copy. SpaceX was originally funded, at low level, to serve as a backup to Boeing, but managed to bypass them. They now provide cheaper, more reliable travel through use of reusable boosters. The program supplying CSS uses traditional, disposable rockets, the Long March 5 and 6 and 7. These resemble the Atlas V, Delta IV and Delta IV Heavy. They appear to be reliable, but I suspect they are costly too. China is currently developing a series of reusable rocket systems. The Long March 9, for example will have the same lift capacity as SapceX’s Starship, we’re told. Will the Indian program choose this rocket to lift their space station, or will they choose SpaceX, or something else? The advantages of a reusable product mostly show up when you get to reuse it, IMHO.
Robert Buxbaum, September 10, 2024.