Category Archives: Engineering

How tall could you make a skyscraper?

Built in 1931, the highest usable floor space of the Empire State building is 1250 feet (381m) above the ground. In 1973, that record was beaten by the World Trade Center building 1, 1,368 feet (417 m, building 2 was eight feet shorter). The Willis Tower followed 1974, and by 2004, the tallest building was the Taipei Tower, 1471 feet. Building heights had grown by 221 feet since 1931, and then the Burj Khalifa in Dubai, 2,426 ft ( 739.44m):. This is over 1000 feet taller than the new freedom tower, and nearly as much taller than the previous record holder. With the Saudi’s beginning work on a building even taller, it’s worthwhile asking how tall you could go, if your only  limitations were ego and materials’ strength.

Burj Khalifa, the world’s tallest building, Concrete + glass structure. Dubai tourism image.

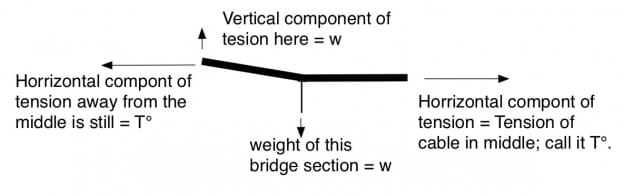
Having written about how long you could make a (steel) suspension bridge, the maximum height of a skyscraper seems like a logical next step. At first glance this would seem like a ridiculously easy calculation based on the math used to calculate the maximum length of a suspension bridge. As with the bridge, we’d make the structure from the strongest normal material: T1, low carbon, vanadium steel, and we’d determine the height by balancing this material’s  yield strength, 100,000 psi (pounds per square inch), against its density, .2833 pounds per cubic inch.

If you balance these numbers, you calculate a height: 353,000 inches, 5.57 miles, but this is the maximum only for a certain structure, a wide flag-pole of T1 steel in the absent of wind. A more realistic height assumes a building where half the volume is empty space, used for living and otherwise, where 40% of the interior space contains vertical columns of T1 steel, and where there’s a significant amount of dead-weight from floors, windows, people, furniture, etc. Assume the dead weight is the equivalent of filling 10% of the volume with T1 steel that provides no structural support. The resulting building has an average density = (1/2 x 0.2833 pound/in3), and the average strength= (0.4 x 100,000 pound/in2). Dividing these numbers we get a maximum height, but only for a cylindrical building with no safety margin, and no allowance for wind.

H’max-cylinder = 0.4 x 100,000 pound/in2/ (.5 x 0.2833 pound/in3) = 282,400 inches = 23,532 ft = 4.46 miles.

This is more than ten times the Burj Khalifa, but it likely underestimates the maximum for a steel building, or even a concrete building because a cylinder is not the optimum shape for maximum height. If the towers were constructed conical or pyramidal, the height could be much greater: three times greater because the volume of a cone and thus its weight is 1/3 that of a cylinder for the same base and height. Using the same materials and assumptions,

The tallest building of Europe is the Shard; it’s a cone. The Eiffel tower, built in the 1800s, is taller.

H’max-cone = 3 H’max-cylinder =  13.37 miles.

A cone is a better shape for a very tall tower, and it is the shape chosen for “the shard”, the second tallest building in Europe, but it’s not the ideal shape. The ideal, as we’ll see, is something like the Eiffel tower.

Before speaking about this shape, I’d like to speak about building materials. At the heights we’re discussing, it becomes fairly ridiculous to talk about a steel and glass building. Tall steel buildings have serious vibration problems. Even at heights far before they are destroyed by wind and vibration , the people at the top will begin to feel quite sea-sick. Because of this, the tallest buildings have been constructed out of concrete and glass. Concrete is not practical for bridges since concrete is poor in tension, but concrete can be quite strong in compression, as I discussed here.  And concrete is fire resistant, sound-deadening, and vibration dampening. It is also far cheaper than steel when you consider the ease of construction. The Trump Tower in New York and Chicago was the first major building here to be made this way. It, and it’s brother building in Chicago were considered aesthetic marvels until Trump became president. Since then, everything he’s done is ridiculed. Like the Trump tower, the Burj Khalifa is concrete and glass, and I’ll assume this construction from here on.

let’s choose to build out of high-silica, low aggregate, UHPC-3, the strongest concrete in normal construction use. It has a compressive strength of 135 MPa (about 19,500 psi). and a density of 2400 kg/m3 or about 0.0866 lb/in3. Its cost is around $600/m3 today (2019); this is about 4 times the cost of normal highway concrete, but it provides about 8 times the compressive strength. As with the steel building above, I will assume that, at every floor, half of the volume is living space; that 40% is support structure, UHPC-3, and that the other 10% is other dead weight, plumbing, glass, stairs, furniture, and people. Calculating in SI units,

H’max-cylinder-concrete = .4 x 135,000,000 Pa/(.5 x 2400 kg/m3 x 9.8 m/s2) = 4591 m = 2.85 miles.

The factor 9.8 m/s2 is necessary when using SI units to account for the acceleration of gravity; it converts convert kg-weights to Newtons. Pascals, by the way, are Newtons divided by square meters, as in this joke. We get the same answer with less difficulty using inches.

H’max-cylinder-concrete = .4 x 19,500 psi/(.5 x.0866  lb/in3) = 180,138″ = 15,012 ft = 2.84 miles

These maximum heights are not as great as for a steel construction, but there are a few advantages; the price per square foot is generally less. Also, you have fewer problems with noise, sway, and fire: all very important for a large building. The maximum height for a conical concrete building is three times that of a cylindrical building of the same design:

H’max–cone-concrete = 3 x H’max-cylinder-concrete = 3 x 2.84 miles = 8.53 miles.

Mount Everest, picture from the Encyclopedia Britannica, a stone cone, 5.5 miles high.

That this is a reasonable number can be seen from the height of Mount Everest. Everest is rough cone , 5.498 miles high. This is not much less than what we calculate above. To reach this height with a building that withstands winds, you have to make the base quite wide, as with Everest. In the absence of wind the base of the cone could be much narrower, but the maximum height would be the same, 8.53 miles, but a cone is not the optimal shape for a very tall building.

I will now calculate the optimal shape for a tall building in the absence of wind. I will start at the top, but I will aim for high rent space. I thus choose to make the top section 31 feet on a side, 1,000 ft2, or 100 m2. As before, I’ll make 50% of this area living space. Thus, each apartment provides 500 ft2 of living space. My reason for choosing this size is the sense that this is the smallest apartment you could sell for a high premium price. Assuming no wind, I can make this part of the building a rectangular cylinder, 2.84 miles tall, but this is just the upper tower. Below this, the building must widen at every floor to withstand the weight of the tower and the floors above. The necessary area increases for every increase in height as follows:

dA/dΗ = 1/σ dW/dH.

Here, A is the cross-sectional area of the building (square inches), H is height (inches), σ is the strength of the building material per area of building (0.4 x 19,500 as above), and dW/dH is the weight of building per inch of height. dW/dH equals  A x (.5 x.0866  lb/in3), and

dA/dΗ = 1/ ( .4 x 19,500 psi) x A x (.5 x.0866  lb/in3).

dA/A = 5.55 x 10⁻⁶ dH,

∫dA/A = ∫5.55 x 10⁻⁶ dH,

ln (Abase/Atop) = 5.55 x 10⁻⁶ ∆H,

Here, (Abase/Atop) = Abase sq feet /1000, and ∆H is the height of the curvy part of the tower, the part between the ground and the 2.84 mile-tall, rectangular tower at the top.

Since there is no real limit to how big the base can be, there is hardly a limit to how tall the tower can be. Still, aesthetics place a limit, even in the absence of wind. It can be shown from the last equation above that stability requires that the area of the curved part of the tower has to double for every 1.98 miles of height: 1.98 miles = ln(2) /5.55 x 10-6 inches, but the rate of area expansion also keeps getting bigger as the tower gets heavier.  I’m going to speculate that, because of artistic ego, no builder will want a tower that slants more than 45° at the ground level (the Eiffel tower slants at 51°). For the building above, it can be shown that this occurs when:

dA/dH = 4√Abase.  But since

dA/dH = A 5.55 x 10⁻⁶ , we find that, at the base,

5.55 x 10⁻⁶ √Abase = 4.

At the base, the length of a building side is Lbase = √Abase=  4 /5.55 x 10-6 inches = 60060 ft = 11.4  miles. Artistic ego thus limits the area of the building to slightly over 11 miles wide of 129.4 square miles. This is about the area of Detroit. From the above, we calculate the additional height of the tower as

∆H = ln (Abase/Atop)/ 5.55 x 10⁻⁶ inches =  15.1/ 5.55 x 10⁻⁶ inches = 2,720,400 inches = 226,700 feet = 42.94 miles.

Hmax-concrete =  2.84 miles + ∆H = 45.78 miles. This is eight times the height of Everest, and while air pressure is pretty low at this altitude, it’s not so low that wind could be ignored. One of these days, I plan to show how you redo this calculation without the need for calculus, but with the inclusion of wind. I did the former here, for a bridge, and treated wind here. Anyone wishing to do this calculation for a basic maximum wind speed (100 mph?) will get a mention here.

From the above, it’s clear that our present buildings are nowhere near the maximum achievable, even for construction with normal materials. We should be able to make buildings several times the height of Everest. Such Buildings are worthy of Nimrod (Gen 10:10, etc.) for several reasons. Not only because of the lack of a safety factor, but because the height far exceeds that of the highest mountain. Also, as with Nimrod’s construction, there is a likely social problem. Let’s assume that floors are 16.5 feet apart (1 rod). The first 1.98 miles of tower will have 634 floors with each being about the size of Detroit. Lets then assume the population per floor will be about 1 million; the population of Detroit was about 2 million in 1950 (it’s 0.65 million today, a result of bad government). At this density, the first 1.98 miles will have a population of 634 million, about double that of the United States, and the rest of the tower will have the same population because the tower area contracts by half every 1.98 miles, and 1/2 + 1/4 + 1/8 + 1/16 … = 1.

Nimrod examining the tower, Peter Breugel

We thus expect the tower to hold 1.28 Billion people. With a population this size, the tower will develop different cultures, and will begin to speak different languages. They may well go to war too — a real problem in a confined space. I assume there is a moral in there somewhere, like that too much unity is not good. For what it’s worth, I even doubt the sanity of having a single government for 1.28 billion, even when spread out (e.g. China).

Robert Buxbaum, June 3, 2019.

How long could you make a suspension bridge?

The above is one of the engineering questions that puzzled me as a student engineer at Brooklyn Technical High School and at Cooper Union in New York. The Brooklyn Bridge stood as a wonder of late 1800s engineering, and it had recently been eclipsed by the Verrazano bridge, a pure suspension bridge. At the time it was the longest and heaviest in the world. How long could a bridge be made, and why did Brooklyn bridge have those catenary cables, when the Verrazano didn’t? (Sometimes I’d imagine a Chinese engineer being asked the top question, and answering “Certainly, but How Long is my cousin.”)

I found the above problem unsolvable with the basic calculus at my disposal. because it was clear that both the angle of the main cable and its tension varied significantly along the length of the cable. Eventually I solved this problem using a big dose of geometry and vectors, as I’ll show.

Vector diagram of forces on the cable at the center-left of the bridge.

Vector diagram of forces on the cable at the center-left of the bridge.

Consider the above vector diagram (above) of forces on a section of the main cable near the center of the bridge. At the right, the center of the bridge, the cable is horizontal, and has a significant tension. Let’s call that T°. Away from the center of the bridge, there is a vertical cable supporting a fraction of  roadway. Lets call the force on this point w. It equals the weight of this section of cable and this section of roadway. Because of this weight, the main cable bends upward to the left and carries more tension than T°. The tangent (slope) of the upward curve will equal w/T°, and the new tension will be the vector sum along the new slope. From geometry, T= √(w2 +T°2).

Vector diagram of forces on the cable further from the center of the bridge.

Vector diagram of forces on the cable further from the center of the bridge.

As we continue from the center, there are more and more verticals, each supporting approximately the same weight, w. From geometry, if w weight is added at each vertical, the change in slope is always w/T° as shown. When you reach the towers, the weight of the bridge must equal 2T Sin Θ, where Θ is the angle of the bridge cable at the tower and T is the tension in the cable at the tower.

The limit to the weight of a bridge, and thus its length, is the maximum tension in the main cable, T, and the maximum angle, that at the towers. Θ. I assumed that the maximum bridge would be made of T1 bridge steel, the strongest material I could think of, with a tensile strength of 100,000 psi, and I imagined a maximum angle at the towers of 30°. Since there are two towers and sin 30° = 1/2, it becomes clear that, with this 30° angle cable, the tension at the tower must equal the total weight of the bridge. Interesting.

Now, to find the length of the bridge, note that the weight of the bridge is proportional to its length times the density and cross section of the metal. I imagined a bridge where the half of the weight was in the main cable, and the rest was in the roadway, cars and verticals. If the main cable is made of T1 “bridge steel”, the density of the cable is 0.2833 lb/in3, and the density of the bridge is twice this. If the bridge cable is at its yield strength, 100,000 psi, at the towers, it must be that each square inch of cable supports 50,000 pounds of cable and 50,000 lbs of cars, roadway and verticals. The maximum length (with no allowance for wind or a safety factor) is thus

L(max) = 100,000 psi / 2 x 0.2833 pounds/in3 = 176,500 inches = 14,700 feet = 2.79 miles.

This was more than three times the length of the Verrazano bridge, whose main span is ‎4,260 ft. I attributed the difference to safety factors, wind, price, etc. I then set out to calculate the height of the towers, and the only rational approach I could think of involved calculus. Fortunately, I could integrate for the curve now that I knew the slope changed linearly with distance from the center. That is for every length between verticals, the slope changes by the same amount, w/T°. This was to say that d2y/dx2 = w/T° and the curve this described was a parabola.

Rather than solving with heavy calculus, I noticed that the slope, dy/dx increases in proportion to x, and since the slope at the end, at L/2, was that of a 30° triangle, 1/√3, it was clear to me that

dy/dx = (x/(L/2))/√3

where x is the distance from the center of the bridge, and L is the length of the bridge, 14,700 ft. dy/dx = 2x/L√3.

We find that:
H = ∫dy = ∫ 2x/L√3 dx = L/4√3 = 2122 ft,

where H is the height of the towers. Calculated this way, the towers were quite tall, higher than that of any building then standing, but not impossibly high (the Dubai tower is higher). It was fairly clear that you didn’t want a tower much higher than this, though, suggesting that you didn’t want to go any higher than a 30° angle for the main cable.

I decided that suspension bridges had some advantages over other designs in that they avoid the problem of beam “buckling.’ Further, they readjust their shape somewhat to accommodate heavy point loads. Arch and truss bridges don’t do this, quite. Since the towers were quite a lot taller than any building then in existence, I came to I decide that this length, 2.79 miles, was about as long as you could make the main span of a bridge.

I later came to discover materials with a higher strength per weight (titanium, fiber glass, aramid, carbon fiber…) and came to think you could go longer, but the calculation is the same, and any practical bridge would be shorter, if only because of the need for a safety factor. I also came to recalculate the height of the towers without calculus, and got an answer that was shorter, for some versions, a hundred feet shorter, as shown here. In terms of wind, I note that you could make the bridge so heavy that you don’t have to worry about wind except for resonance effects. Those are the effects are significant, but were not my concern at the moment.

The Brooklyn Bridge showing its main cable suspension structure and its catenaries.

Now to discuss catenaries, the diagonal wires that support many modern bridges and that, on the Brooklyn bridge, provide  support at the ends of the spans only. Since the catenaries support some weight of the Brooklyn bridge, they decrease the need for very thick cables and very high towers. The benefit goes down as the catenary angle goes to the horizontal, though as the lower the angle the longer the catenary, and the lower the fraction of the force goes into lift. I suspect this is why Roebling used catenaries only near the Brooklyn bridge towers, for angles no more than about 45°. I was very proud of all this when I thought it through and explained it to a friend. It still gives me joy to explain it here.

Robert Buxbaum, May 16, 2019.  I’ve wondered about adding vibration dampers to very long bridges to decrease resonance problems. It seems like a good idea. Though I have never gone so far as to do calculations along these lines, I note that several of the world’s tallest buildings were made of concrete, not steel, because concrete provides natural vibration damping.

A hydrogen permeation tester

Over the years I’ve done a fair amount of research on hydrogen permeation in metals — this is the process of the gas dissolving in the metal and diffusing to the other side. I’ve described some of that, but never the devices that measure the permeation rate. Besides, my company, REB Research, sells permeation testing devices, though they are not listed on our site. We recently shipped one designed to test hydrogen permeation through plastics for use in light weight hydrogen tanks, for operation at temperatures from -40°C to 85°C. Shortly thereafter we got another order for a permeation tester. With all the orders, I thought I’d describe the device a bit — this is the device for low permeation materials. We have a similar, but less complex design for high permeation rate material.

Shown below is the central part of the device. It is a small volume that can be connected to a high vacuum, or disconnected by a valve. There is an accurate pressure sensor, accurate to 0.01 Torr, and so configured that you do not get H2 + O2 reactions (something that would severely throw off results). There is also a chamber for holding a membrane so one side is help in vacuum, in connection to the gauge, and the other is exposed to hydrogen, or other gas at pressures up to 100 psig (∆P =115 psia). I’d tested to 200 psig, but currently feel like sticking to 100 psig or less. This device gives amazingly fast readings for plastics with permeabilities as low as 0.01 Barrer.

REB Research hydrogen permeation tester cell with valve and pressure sensor.

REB Research hydrogen permeation tester cell with valve and pressure sensor.

To control the temperature in this range of interest, the core device shown in the picture is put inside an environmental chamber, set up as shown below, with he control box outside the chamber. I include a nitrogen flush device as a safety measure so that any hydrogen that leaks from the high pressure chamber will not build up to reach explosive limits within the environmental chamber. If this device is used to measure permeation of a non-flammable gas, you won’t need to flush the environmental chamber.

I suggest one set up the vacuum pump right next to the entrance of the chamber; in the case of the chamber provided, that’s on the left as shown with the hydrogen tank and a nitrogen tank to the left of the pump. I’ve decided to provide a pressure sensor for the N2 (nitrogen) and a solenoidal shutoff valve for the H2 (hydrogen) line. These work together as a safety feature for long experiments. Their purpose is to automatically turn off the hydrogen if the nitrogen runs out. The nitrogen flush part of this process is a small gauge copper line that goes from the sensor into the environmental chamber with a small, N2 flow bleed valve at the end. I suggest setting the N2 pressure to 25-35 psig. This should give a good inert flow into the environmental chamber. You’ll want a nitrogen flush, even for short experiments, and most experiments will be short. You may not need an automatic N2 sensor, but you’ll be able to do this visually.

Basic setup for REB permeation tester and environmental chamber

Basic setup for REB permeation tester and environmental chamber

I shipped the permeation cell comes with some test, rubbery plastic. I’d recommend the customer leave it in for now, so he/she can use it for some basic testing. For actual experiments, you replace mutest plastic with the sample you want to check. Connect the permeation cell as shown above, using VCR gaskets (included), and connect the far end to the multi-temperature vacuum hose, provided. Do this outside of the chamber first, as a preliminary test to see if everything is working.

For a first test live the connections to the high pressure top section unconnected. The pressure then will be 1 atm, and the chamber will be full of air. eave the top, Connect the power to the vacuum pressure gauge reader and connect the gauge reader to the gauge head. Open the valve and turn on the pump. If there are no leaks the pressure should fall precipitously, and you should see little to no vapor coming out the out port on the vacuum pump. If there is vapor, you’ve got a leak, and you should find it; perhaps you didn’t tighten a VCR connection, or you didn’t do a good job with the vacuum hose. When things are going well, you should see the pressure drop to the single-digit, milliTorr range. If you close the valve, you’ll see the pressure rise in the gauge. This is mostly water and air degassing from the plastic sample. After 30 minutes, the rate of degassing should slow and you should be able to measure the rate of gas permeation in the polymer. With my test plastic, it took a minute or so for the pressure to rise by 10 milliTorr after I closed the valve.

If you like, you can now repeat this preliminary experiment with hydrogen connect the hydrogen line to one of the two ports on the top of the permeation cell and connect the other port to the rest of the copper tubing. Attach the H2 bleed restrictor (provided) at the end of this tubing. Now turn on the H2 pressure to some reasonable value — 45 psig, say. With 45 psi (3 barg upstream) you will have a ∆P of 60 psia or 4 atm across the membrane; vacuum equals -15 psig. Repeat the experiment above; pump everything down, close the valve and note that the pressure rises faster. The restrictor allows you to maintain a H2 pressure with a small, cleansing flow of gas through the cell.

If you like to do these experiments with a computer record, this might be a good time to connect your computer to the vacuum reader/ controller, and to the thermocouple, and to the N2 pressure sensor. 

Here’s how I calculate the permeability of the test polymer from the time it takes for a pressure rise assuming air as the permeating gas. The volume of the vacuumed out area after the valve is 32 cc; there is an open area in the cell of 13.0 cm2 and, as it happens, the  thickness of the test plastic is 2 mm. To calculate the permeation rate, measure the time to rise 10 millitorr. Next calculate the millitorr per hour: that’s 360 divided by the time to rise ten milliTorr. To calculate ncc/day, multiply the millitorr/hour by 24 and by the volume of the chamber, 32 cc, and divide by 760,000, the number of milliTorr in an atmosphere. I found that, for air permeation at ∆P = one atm, I was getting 1 minute per milliTorr, which translates to about 0.5 ncc/day of permeation through my test polymer sheet. To find the specific permeability in cc.mm/m2.day.atm, I multiply this last number by the thickness of the plastic (2 mm in this case), divide by the area, 0.0013 m2, and divide by ∆P, 1 atm, for this first test. Calculated this way, I got an air permeance of 771 cc.mm/m2.day.atm.

The complete setup for permeation testing.

The complete setup for permeation testing.

Now repeat the experiment with hydrogen and your own plastic. Disconnect the cell from both the vacuum line and from the hydrogen in line. Open the cell; take out my test plastic and replace it with your own sample, 1.87” diameter, or so. Replace the gasket, or reuse it. Center the top on the bottom and retighten the bolts. I used 25 Nt-m of torque, but part of that was using a very soft rubbery plastic. You might want to use a little more — perhaps 40-50 Nt-m. Seal everything up. Check that it is leak tight, and you are good to go.

The experimental method is the same as before and the only signficant change when working with hydrogen, besides the need for a nitrogen flush, is that you should multiply the time to reach 10 milliTorr by the square-root of seven, 2.646. Alternatively, you can multiply the calculated permeability by 0.378. The pressure sensor provided measures heat transfer and hydrogen is a better heat transfer material than nitrogen by a factor of √7. The vacuum gauge is thus more sensitive to H2 than to N2. When the gauge says that a pressure change of 10 milliTorr has occurred, in actuality, it’s only 3.78 milliTorr.  The pressure gauge reads 3.78 milliTorr oh hydrogen as 10 milliTorr.

You can speed experiments by a factor of ten, by testing the time to rise 1 millitorr instead of ten. At these low pressures, the gauge I provided reads in hundredths of a milliTorr. Alternately, for higher permeation plastics (or metals) you want to test the time to rise 100 milliTorr or more, otherwise the experiment is over too fast. Even at a ten millTorr change, this device gives good accuracy in under 1 hour with even the most permeation-resistant polymers.

Dr. Robert E. Buxbaum, March 27, 2019; If you’d like one of these, just ask. Here’s a link to our web site, REB Research,

Why concrete cracks and why sealing is worthwhile

The oil tanker Palo Alto is one of several major ships made with concrete hulls.

The oil tanker Palo Alto is one of several major ships made with concrete hulls.

Modern concrete is a wonderful construction material. Major buildings are constructed of it, and major dams, and even some ships. But under the wrong circumstances, concrete has a surprising tendency to crack and fail. I thought I’d explain why that happens and what you can do about it. Concrete does not have to crack easily; ancient concrete didn’t and military or ship concrete doesn’t today. A lot of the fault lies in the use of cheap concrete — concrete with lots of filler — and with the cheap way that concrete is laid. First off, the major components of modern concrete are pretty uniform: sand and rock, Portland cement powder (made from cooked limestone, mostly), water, air, and sometimes ash. The cement component is what holds it all together — cements it together as it were — but it is not the majority of even the strongest concretes. The formula of cement has changed too, but the cement is not generally the problem. It doesn’t necessarily stick well to the rock or sand component of concrete (It sticks far better to itself) but it sticks well enough that spoliation, isn’t usually a problem by itself.

What causes problem is that the strength of concrete is strongly affected (decreased) by having lots of sand, aggregate and water. The concrete used in sidewalks is as cheap as possible, with lots of sand and aggregate. Highway and wall concrete has less sand and aggregate, and is stronger. Military and ship concrete has little sand, and is quite a lot stronger. The lowest grade, used in sidewalks, is M5, a term that refers to its compressive strength: 5 Mega Pascals. Pascals are European (Standard International) units of pressure and of strength. One Pascal is one Newton per square meter (Here’ a joke about Pascal units). In US (English) units, 5 MPa is 50 atm or 750 psi.

Ratios for concrete mixes of different strength.

Ratios for concrete mixes of different strength; the numbers I use are double these because these numbers don’t include water; that’s my “1”.

The ratio of dry ingredients in various concretes is shown at right. For M5, and including water, the ratio is 1 2 10 20. That is to say there is one part water, two parts cement, 10 parts sand, and 20 parts stone-aggregate (all these by weight). Added to this is 2-3% air, by volume, or nearly as much air as water. At least these are the target ratios; it sometimes happens that extra air and water are added to a concrete mix by greedy or rushed contractors. It’s sometimes done to save money, but more often because the job ran late. The more the mixer turns the more air gets added. If it turns too long there is extra air. It the job runs late, workers will have to add extra water too because the concrete starts hardening. I you see workers hosing down wet concrete as it comes from the truck, this is why. As you might expect, extra air and water decrease the strength of the product. M-10 and M-20 concrete have less sand, stone, and water as a proportion to cement. The result is 10 MPa or 20 MPa strength respectively.

A good on-site inspector is needed to keep the crew from adding too much water. Some water is needed for the polymerization (setting) of the concrete. The rest is excess, and when it evaporates, it leaves voids that are similar to the voids created by having air mix in. It is not uncommon to find 6% voids, in commercial concrete. This is to say that, after the water evaporates, the concrete contains about as much void as cement by volume. To get a sense of how much void space is in the normal concrete outside your house, go outside to a piece of old concrete (10 years old at least) on a hot, dry day, and pour out a cup of water. You will hear a hiss as the water absorbs, and you will see bubbles come out as the water goes in. It used to be common for cities to send inspectors to measuring the void content of the wet (and dry) concrete by a technique called “pycnometry” (that’s Greek for density measurement). I’ve not seen a local city do this in years, but don’t know why. An industrial pycnometer is shown below.

Pyncnometer used for concrete. I don't see these in use much any more.

Pycnometer used for concrete. I don’t see these in use much any more.

One of the main reason that concrete fails has to do with differential expansion, thermal stress, a concept I dealt with some years ago when figuring out how cold it had to be to freeze the balls off of a brass monkey. As an example of the temperature change to destroy M5, consider that the thermal expansion of cement is roughly 1 x 10-5/ °F or 1.8 x10-5/°C. This is to say that a 1 meter slab of cement that is heated or cooled by 100°F will expand or shrink by 10-3 m respectively; 100 x 1×10-5 = 10-3. This is a fairly large thermal expansion coefficient, as these things go. It would not cause stress-failure except that sand and rock have a smaller thermal expansion coefficients, about 0.6×10⁻⁵ — barely more than half the value for cement. Consider now what happens to concrete that s poured in the summer when it is 80°F out, and where the concrete heats up 100°F on setting (cement setting releases heat). Now lets come back in winter when it’s 0°F. This is a total of 100°F of temperature change. The differential expansion is 0.4 x 10⁻⁵/°F x 100°F =  4 x10⁻⁴ meter/meter = 4 x10⁻⁴ inch/inch.

The force created by this differential expansion is the elastic modulus of the cement times the relative change in expansion. The elastic modulus for typical cement is 20 GPa or, in English units, 3 million psi. This is to say that, if you had a column of cement (not concrete), one psi of force would compress it by 1/3,000,000. The differential expansion we calculated, cement vs sand and stone is 4×10⁻⁴ ; this much expansion times the elastic modulus, 3,000,000 = 1200 psi. Now look at the strength of the M-5 cement; it’s only 750 psi. When M-5 concrete is exposed to these conditions it will not survive. M-10 will fail on its own, from the temperature change, without any help needed from heavy traffic. You’d really like to see cities check the concrete, but I’ve seen little evidence that they do.

Water makes things worse, and not only because it creates voids when it evaporates. Water also messes up the polymerization reaction of the cement. Basic, fast setting cement is mostly Ca3SiO5

2Ca3SiO5 + 6 H2O –> 3Ca0SiO2•H2O +3Ca(OH)2•H2O.

The former of these, 3Ca0SiO2•H2O, forms something of a polymer. Monomer units of SiO4 are linked directly or by partially hydrated CaO linkages. Add too much water and the polymeric linkages are weakened or do not form at all. Over time the Ca(OH)2 can drain away or react with  CO2 in the air to form chalk.

concrete  strength versus-curing time. Slow curing of damp concrete helps; fast dry hurts. Carbonate formation adds little or no strength. Jehan Elsamni 2011.

Portland limestone cement strength versus curing time. Slow curing and damp helps; fast dry hurts. Carbonate formation adds little or no strength. Jehan Elsamni 2011.

Ca(OH)2 + CO2 → CaCO3 + H2O

Sorry to say, the chalk adds little or no strength, as the graph at right shows. Concrete made with too much water isn’t very strong at all, and it gets no stronger when dried in air. Hardening goes on for some weeks after pouring, and this is the reason you don’t drive on 1 too 2 day old concrete. Driving on weak concrete can cause cracks that would not form if you waited.

You might think to make better concrete by pouring concrete in the cold, but pouring in the cold makes things worse. Cold poured cement will expand the summer and the cement will detach from the sand and stone. Ideally, pouring should be in spring or fall, when the temperature is moderate, 40-60°F. Any crack that develops grows by a mechanism called Rayleigh crack growth, described here. Basically, once a crack starts, it concentrates the fracture forces, and any wiggling of the concrete makes the crack grow faster.

Based on the above, I’ve come to suspect that putting on a surface coat can (could) help strengthen old concrete, even long after it’s hardened. Mostly this would happen by filling in voids and cracks, but also by extending the polymer chains. I imagine it would be especially helpful to apply the surface coat somewhat watery on a dry day in the summer. In that case, I imagine that Ca3SiO5 and Ca(OH)2 from the surface coat will penetrate and fill the pores of the concrete below — the sales pores that hiss when you pour water on them. I imagine this would fill cracks and voids, and extend existing CaOSiO2•H2O chains. The coat should add strength, and should be attractive as well. At least that was my thought.

I should note that, while Portland cement is mostly Ca3SiO5, there is also a fair amount (25%) of Ca2SiO4. This component reacts with water to form the same calcium-silicate polymer as above, but does so at a slower rate using less water per gram. My hope was that this component would be the main one to diffuse into deep pores of the concrete, reacting there to strengthen the concrete long after surface drying had occurred.

Trump tower: 664', concrete and glass. What grade of concrete would you use?

Trump tower: 664′, concrete and glass. What grade of concrete would you use?

As it happened, I had a chance to test my ideas this summer and also about 3 years ago. The city inspector came by to say the concrete flags outside my house were rough, and thus needed replacing, and that I was to pay or do it myself. Not that I understand the need for smooth concrete, quite, but that’s our fair city. I applied for a building permit to apply a surface coat, and applied it watery. I used “Quickrete” brand concrete patch, and so far it’s sticking OK. Pock-holes in the old concrete have been filled in, and so far surface is smooth. We’ll have to see if my patch lasts 10-20 years like fresh cement. Otherwise, no matter how strong the concrete becomes underneath, the city will be upset, and I’ll have to fix it. I’ve noticed that there is already some crumbling at the sides of flags, something I attribute to the extra water. It’s not a problem yet, but hope this is not the beginning of something worse. If I’m wrong here, and the whole seal-coat flakes off, I’ll be stuck replacing the flags, or continuing to re-coat just to preserve my reputation. But that’s the cost of experimentation. I tried something new, and am blogging about it in the hope that you and I benefit. “Education is what you get when you don’t get what you want.” (It’s one of my wise sayings). At the worst, I’ll have spent 90 lb of patching cement to get an education. And, I’m happy to say that some of the relatively new concrete flags that the city put in are already cracked. I attribute this to: too much sand, air, water or air (they don’t look like they have much rock): Poor oversight.

Dr. Robert E. Buxbaum. March 5, 2019. As an aside, the 664 foot Trump Tower, NY is virtually the only skyscraper in the city to be built of concrete and glass. The others are mostly steel and glass. Concrete and glass is supposed to be stiffer and quieter. The engineer overseeing the project was Barbara Res, the first woman to oversee a major, NY building project. Thought question: if you built the Trump Tower, which quality of concrete would you use, and why.

Great waves, small circles, and the spread of ideas.

Simplified wave motion, GIf by Dan Russel (maybe? I think?).

The scientific method involves looking closely at things. Sometimes we look closely for a purpose — to make a better mouse-trap, say. But sometimes it’s just to understand what’s happening: to satisfy curiosity, to understand the way the world works, or to answer a child. Both motivations bring positive results, but there is a difference in how people honor the product of these motivations. Scientific knowledge developed for curiosity is considered better; it tends to become the model for social understanding, and for art and literature. Meanwhile, science developed for a purpose is considered suspect, and often that suspicion is valid. A surprising amount of our knowledge was developed for war: for the purpose of killing people, destroying things, and occupying lands.

Waves provide a wonderful example of science exploration that was developed mostly for curiosity, and so they have become models of social understanding and culture — far more so than the atom bomb and plague work discussed previously.

Waves appear magical: You poke a pond surface with a stick, and the influence of that poke travels, as if by magic, to all corners of the pond. Apparently the initial poke set off something, and that sets off something else, and we’ve come to use this as a model for cultural ideas. Any major change in music, art, or cultural thought is described as a wave (and not as a disease). The sense of wave is  that a small push occurs, and the impact travels across a continent and across an ocean. The Gifs above and below shows how this happens for the ordinary wave — the one with a peaked top. As shown, the bits of water do not move with the wave. Instead they just circulate in a small circle. The powerful waves that crosses an ocean are composed of many small circles of water rolling in the general direction of the wave. With ideas too, I think, one person can push a second, and that second a third, each acting in his or her own circle, and a powerful transmission of ideas results. Of course, for a big wave, you need a big circle, but maybe not in cases of reflection (reflected waves can add, sometimes very destructively).

simplified wave movement

In the figures I’ve shown, you will notice that the top of the circle always moves in the same direction as the top of the wave. If the wave moves to the right, the circle is clockwise. There are also Rayleigh waves. In these, the top of the wave is not peaked, but broad, with little indents between ripples. For Rayleigh wave the motion is not circular, but elliptical, and the top of the ellipse moves in the opposite direction to that of the wave. These waves go slower than the normal waves, but they are more destructive. Most of the damage of earthquakes is by the late-arriving Rayleigh waves.

If regular waves are related to fast-moving ideas, like rock n roll, Rayleigh waves might be related to slower-traveling, counter-intuitive ideas, paradigm shifts: Religions, chaos, entropyfeminism, or communism. Rayleigh waves are mostly seen in solids, and the destructive power of counter-intuitive ideas is mostly seen in rigid societies.

Then there are also pressure waves, like sound, and wiggle waves (transverse waves). Pressure waves travel the fastest, and work in both solids and liquids. Wiggle waves travel slower (and don’t travel in liquids). Both of these involve no circles at all, but just one bit of material pushing on its neighbor. I think the economy works this way: bouncing springs, for the most part. Life is made up of all of these, and life is good. The alternative to vibration, I should mention, is status. Status is a form of death. There is a certain sort of person who longs for nothing more than an unchanging, no-conflict world: one government and one leadership. Avoid such people.

Robert Buxbaum, February 10, 2019

Why the earth is magnetic with the north pole heading south.

The magnetic north pole, also known as true north, has begun moving south. It had been moving toward the north pole thought the last century. It moved out of Canadian waters about 15 years ago, heading toward Russia. This year it passed as close to the North pole as it is likely to, and begun heading south (Das Vedanga, old friend). So this might be a good time to ask “why is it moving?” or better yet, “Why does it exist at all?” Sorry to say the Wikipedia page is little help here; what little they say looks very wrong. So I thought I’d do my thing and write an essay.

The motion of the magnetic (true) north pole over the last century; it's nearly at the north pole.

Migration of the magnetic (true) north pole over the last century; it’s at 8°N and just passed the North Pole.

Your first assumption of the cause of the earth’s magnetic field would involve ferromagnetism: the earth’s core is largely iron and nickel, two metals that permanent magnets. Although the earth’s core is very hot, far above the “Curie Temperature” where permanent magnets form, you might imagine that some small degree of magnetizability remains. You’d be sort of right here and sort of wrong; to see why, lets take a diversion into the Curie Temperature (Pierre Curie in this case) before presenting a better explanation.

The reason there is no magnetism above the Curie temperature is similar to the reason that you can’t have a plague outbreak or an atom bomb if R-naught is less than one. Imagine a magnet inside a pot of iron. The surrounding iron will dissipate some of the field because magnets are dipoles and the iron occupies space. Fixed dipole effects dissipate with a distance relation of r-4; induced dipoles with a relation r-6. The iron surrounding the magnet will also be magnetized to an extent that augments the original, but the degree of magnetization decreases with temperature. Above some critical temperature, the surrounding dissipates more than it adds and the effect is that the original magnetic effect will die out if the original magnet is removed. It’s the same way that plagues die out if enough people are immunized, discussed earlier.

The earth rotates, and the earth's surface is negatively charged. There is thus some room for internal currents.

The earth rotates, and the earth’s surface is negatively charged. There is thus some room for internal currents.

It seems that the earth’s magnetic field is electromagnetic; that is, it’s caused by a current of some sort. According to Wikipedia, the magnetic field of the earth is caused by electric currents in the molten iron and nickel of the earth’s core. While there is a likely current within the core, I suspect that the effect is small. Wikipedia provides no mechanism for this current, but the obvious one is based on the negative charge of the earth’s surface. If the charge on the surface is non-uniform, It is possible that the outer part of the earth’s core could become positively charged rather the way a capacitor charges. You’d expect some internal circulation of the liquid the metal of the core, as shown above – it’s similar to the induced flow of tornadoes — and that flow could induce a magnetic field. But internal circulation of the metallic core does not seem to be a likely mechanism of the earth’s field. One problem: the magnitude of the field created this way would be smaller than the one caused by rotation of the negatively charged surface of the earth, and it would be in the opposite direction. Besides, it is not clear that the interior of the planet has any charge at all: The normal expectation is for charge to distribute fairly uniformly on a spherical surface.

The TV series, NOVA presents a yet more unlikely mechanism: That motion of the liquid metal interior against the magnetic field of the earth increases the magnetic field. The motion of a metal in a magnetic field does indeed produce a field, but sorry to say, it’s in the opposing direction, something that should be obvious from conservation of energy.

The true cause of the earth’s magnet field, in my opinion, is the negative charge of the earth and its rotation. There is a near-equal and opposite charge of the atmosphere, and its rotation should produce a near-opposite magnetic field, but there appears to be enough difference to provide for the field we see. The cause for the charge on the planet might be due to solar wind or the ionization of cosmic rays. And I notice that the average speed of parts of the atmosphere exceeds that of the surface —  the jet-stream, but it seems clear to me that the magnetic field is not due to rotation of the jet stream because, if that were the cause, magnetic north would be magnetic south. (When positive charges rotate from west to east, as in the jet stream, the magnetic field created in a North magnetic pole a the North pole. But in fact the North magnetic pole is the South pole of a magnet — that’s why the N-side of compasses are attracted to it, so … the cause must be negative charge rotation. Or so it seems to me.  Supporting this view, I note that the magnet pole sometimes flips, north for south, but this is only following a slow decline in magnetic strength, and it never points toward a spot on the equator. I’m going to speculate that the flip occurs when the net charge reverses, thought it could also come when the speed or charge of the jet stream picks up. I note that the magnetic field of the earth varies through the 24 hour day, below.

The earth's magnetic strength varies regularly through the day.

The earth’s magnetic strength varies regularly through the day.

Although magnetic north is now heading south, I don’t expect it to flip any time soon. The magnetic strength has been decreasing by about 6.3% per century. If it continues at that rate (unlikely) it will be some 1600 years to the flip, and I expect that the decrease will probably slow. It would probably take a massive change in climate to change the charge or speed of the jet stream enough to reverse the magnetic poles. Interestingly though, the frequency of magnetic strength variation is 41,000 years, the same frequency as the changes in the planet’s tilt. And the 41,000 year cycle of changes in the planet’s tilt, as I’ve described, is related to ice ages.

Now for a little math. Assume there are 1 mol of excess electrons on a large sphere of the earth. That’s 96500 Coulombs of electrons, and the effective current caused by the earth’s rotation equals 96500/(24 x3600) = 1.1 Amp = i. The magnetic field strength, H =  i N µ/L where H is magnetizability field in oersteds, N is the number of turns, in this case 1, µ is the magnetizability. The magnetizability of air is 0.0125 meter-oersteds/ per ampere-turn, and that of a system with an iron core is about 200 times more, 2.5 meter-tesla/ampere-turn. L is a characteristic length of the electromagnet, and I’ll say that’s 10,000 km or 107 meters. As a net result, I calculate a magnetic strength of 2.75×10⁻⁷ Tesla, or .00275 Gauss. The magnet field of the earth is about 0.3 gauss, suggesting that about 100 mols of excess charge are involved in the earth’s field, assuming that my explanation and my math are correct.

At this point, I should mention that Venus has about 1/100 the magnetic field of the earth despite having a molten metallic core like the earth. It’s rotation time is 243 days. Jupiter, Saturn and Uranus have greater magnetic fields despite having no metallic cores — certainly no molten metallic cores (some theorize a core of solid, metallic hydrogen). The rotation time of all of these is faster than the earth’s.

Robert E. Buxbaum, February 3, 2019. I have two pet peeves here. One is that none of the popular science articles on the earth’s magnetic field bother to show math to back their claims. This is a growing problem in the literature; it robs science of science, and makes it into a political-correctness exercise where you are made to appreciate the political fashion of the writer. The other peeve, related to the above concerns the game it’s thoroughly confusing, and politically ego-driven. The gauss is the cgs unit of magnetic flux density, this unit is called G in Europe but B in the US or England. In the US we like to use the tesla T as an SI – mks units. One tesla equals 104 gauss. The oersted, H is the unit of magnetizing field. The unit is H and not O because the English call this unit the henry because Henry did important work in magnetism One ampere-turn per meter is equal to 4π x 10−3 oersted, a number I approximated to 0.125 above. But the above only refers to flux density; what about flux itself? The unit for magnetic flux is the weber, Wb in SI, or the maxwell, Mx in cgs. Of course, magnetic flux is nothing more than the integral of flux density over an area, so why not describe flux in ampere-meters or gauss-acres? It’s because Ampere was French and Gauss was German, I think.

Water Conservation for Michigan – Why?

The Michigan Association of Planners is big on water conservation, joining several environmental groups to demand legislation requiring water conservation:

POLICY 4. Water Conservation: The Michigan Association of Planning supports state legislation requiring water conservation for public, and private users.

Among the classic legislation passed so far are laws requiring low flush toilets, and prohibiting high-volume shower heads as in this Seinfeld episode. I suppose I should go along: I’m running for water commissioner, and consider myself a conservationist. The problem is, I can’t see a good argument for these laws for most people here in Oakland County, or in neighboring Macomb and Wayne Counties. The water can’t run out because most users take it from the river and return it to the river, cleaned after it’s used; it’s all recycled.

Map of the main drinking-water pipes serving south-east Michigan

Map of the main drinking-water pipes serving south-east Michigan

The map above shows the clean water system for south-east Michigan. The high-population areas, the ones that are colored in the map, get their water from the Detroit River or from Lake Huron. It’s cleaned, pumped, and carried to your home along the pipes shown. Then after you’ve used the water, it travels back along another set of pipes to the water treatment plant and into the Detroit River.

Three-position shower head -- a wonderful home improvement  I got it at universal plumbing.

Three-position shower head — a wonderful home improvement. I got it at universal plumbing.

When the system is working well, the water we return to the Detroit River is cleaner than the water we took in. So why legislate against personal use? If a customer wants to enjoy a good shower, and is willing to pay for the water at 1.5¢ per gallon, who cares how much water that customer uses? I can understand education efforts, sort-of, but find it hard to push legislation like we have against a high-volume shower head. We can not run out, and the more you use, the less everyone pays per gallon. A great shower head is a great gift idea, in my opinion.

The water department does not always work well, by the way, and these problems should be solved by legislation. We give away, for $200/year, high value clean water to Nestle company and then buy it back for $100,000,000. That’s a problem. Non-flushable toilet wipes are marketed as flushable; this causes sewer blockades. Our combined sewers regularly dump contaminated water into our rivers, lakes, and basements. These problems can be solved with legislation and engineering. It’s these problems that I’m running to solve.

Robert Buxbaum, January 6, 2019. If you want to save water, either to save the earth, or because you are cheep, here are some conservation ideas that make sense (to me).

We don’t need no stinking primary clarifier

Virtually every sewage plant of Oakland County uses the activated sludge process, shown in the layout below. Raw sewage comes in, and goes through physical separation — screening, grit removal, and a first clarifier – settling tank before moving to the activated sludge oxidation reactor. The 1st clarifier, shown at left below, removes about half of the incoming organics, but it often stinks and sometimes it “pops” bubbles of fart. This is usually during periods of low flow, like at night. When the flow is slow, it arrives at the plant as a rotting smelly mess; it’s often hard to keep the bubbles of smell down.

Typical Oakland Sewage plant, activated sludge process with a primary clarifier.

Typical Oakland County Sewage treatment plant, activated sludge process with a primary clarifier.

The smell is much improved in the oxidation reactor, analyzed here, and in the 2nd clarifier, shown above at right. Following that is a filter, an ultraviolet cleanup stage, and the liquids are discharged to a local river. In Oakland county, the solids from the two clarifiers are hauled off to a farm, or buried in a landfill. Burial in a landfill is a costly waste, as I discuss here. The throughputs for most of these treatment plants is only about 2-3 million gallons of sewage per day. But Oakland county can produce 500 million gallons of sewage per day. The majority of this goes to Detroit for treatment, and sometimes the overflow is dumped rotting and smelly, in the rivers.

A few months ago, I visited the Sycamore Creek Wastewater facility outside of Cincinnati. This is an 8 million gallon per day plant that uses the “extended aeration process”, shown in the sketch below. I noticed several things I liked: the high throughput (the plant looks no bigger than our 2-3 million gallon plants) and the lack of a bad smell, primarily. The Sycamore Creek plant had an empty hole where the primary clarifier had once been. Lacking this clarifier, the screened sewage could not sit and pop. Instead it goes directly from grit removal to the oxidation reactor, a reactor that looks no bigger than in our plants. This reactor manages a four times higher throughput, I think, because of a higher concentration of cellular catalyst. Consider the following equation derived in a previous post:

ln C°/C = kV/Q.

Here, C° and C are the incoming and exit concentrations of soluble organic; k is the reaction rate, proportional to cellular concentration, V is the volume of the reactor, Q is the flow, and ln is natural log. The higher cellular concentration in the extended aeration plant results in an increased reaction rate, k. The higher the value of k, the higher the allowed flow, Q, per reactor volume, V.

The single clarifier at the end of the Sycamore Creek plant does not look particularly big. My sense is that it deals with a lot more sludge and flow than is seen in our 2nd clarifiers because (I imaging) the sludge is higher density, thus faster settling. I expect that, without the 1 clarifier, there is extra iron and sulfate in the sludge, and more large particles too. In our plants, a lot of these things are removed in the primary clarifier. Sludge density is also increased, I think, because the Cincinnati plant recycle a greater percentage of the sludge (I list it as 90% in the diagram). Extra iron in the reactor also helps to remove phosphates from the water effluent that flows back to the river, an important pollution concern. Iron phosphates are insoluble, and thus leave with the sludge. In Oakland county’s activated sludge plants, it is typical to add iron to the reactor or clarifier. In Cincinnati’s extended aeration plant, I’m told, iron addition is generally not needed.

Typical Oakland Sewage plant, activated sludge process with a primary clarifier.

Cincinnati sewage treatment plant, extended aeration process with no primary clarifier.

The extended aeration part of the above process refers to the secondary sludge oxidizer, the continuously stirred tank reactor, or CSTR shown at lower right above. The “CSTR” is about 1/5 the volume of the main oxidation reactor and about the size of a clarifier. Oxidation in the CSTR compliments that in the main oxidizer removing organics, making bio-polymer, and improving (I think) the quality of the sludge that goes to the farms. Oxidation in the CSTR reduces the amount of sludge that goes to the farms. The sludge that does go, is  less-toxic and more concentrated in organics and minerals. I’m not sure if the CSTR product is as good as the product from an anaerobic digester, or if the CSTR is cheaper to operate, but it looks cheaper since there is no roof, and no (or minimal) heating. This secondary oxidizer is very efficient at removing organics because the cellular catalyst concentration is very high – much higher than in the main oxidizer.

During periods of high load, early morning, the CSTR seems to serve as a holding tank so that sludge does not build up in the clarifier. Too much sludge in the clarifier can start to rot, and ruin the effluent quality. The way you tell if there is too much sludge, by the way, is through a device called the “sludge judge.” I love that name. The Cincinnati plant used a centrifugal drier; none of our plants do. The Cincinnati plant had gap the bubble spots of the main oxidizer. This is good for denitrification, I’m told, an important process that I discuss elsewhere.

The liquid output of their clarifier (or ours) is not pure enough to be sent directly to the river. In this plant, the near-pure water from the clarifier is sent to a trickling filter, a bed of sand and anthracite that removes colloidal remnants. Some of our plants do the same. I suspect that the large surface area in this filter is also home to some catalysis: last stage oxidation of remaining bio-organics. On a regular basis, the filter bed is reverse-flushed to remove cellular buildup, slime, and send it to the beginning of the process. The trickling filter output is then sent to an ultraviolet, bacteria-killing step before being released to the rivers. All in all, I suspect that an extended aeration process like this is worth looking into for Oakland County, especially for our North Pontiac sewage treatment facility. That plant is particularly bad smelling, and clearly too small to treat all its sewage. Perhaps we can increase the throughput and decrease the smell at a minimal cost.

Dr. Robert E. Buxbaum, December 18, 2018. I’m running for water commissioner of Oakland county, MI. If you like, visit my campaign site. Here are some sludge jokes and my campaign song.

A logic joke, and an engineering joke.

The following is an oldish logic joke. I used it to explain a conclusion I’d come to, and I got just a blank stare and a confused giggle, so here goes:

Three logicians walk into a bar. The barman asks: “Do all of you want the daily special?” The first logician says, “I don’t know.” The second says, “I don’t know.” The third says, “yes.”

The point of the joke was that, in several situations, depending on who you ask, “I don’t know” can be a very meaningful answer. Similarly, “I’m not sure.”  While I’m at it, here’s an engineering education joke, it’s based on the same logic, here applied:

A team of student engineers builds an airplane and wheel it out before the faculty. “We’ve designed this plane”, they explain, “based on the principles and methods you taught us. “We’ve checked our calculations rigorously, and we’re sure we’ve missed nothing. “Now. it would be a great honor to us if you would join us on its maiden flight.”

At this point, some of the professors turn white, and all of them provide various excuses for why they can’t go just now. But there is one exception, the dean of engineering smiles broadly, compliments the students, and says he’ll be happy to fly. He gets onboard the plane seating himself in the front of the plane, right behind the pilot. After strapping himself in, a reporter from the student paper comes along and asks why he alone is willing to take this ride; “Why you and no one else?” The engineering dean explains, “You see, son, I have an advantage over the other professors: Not only did I teach many of you, fine students, but I taught many of them as well.” “I know this plane is safe: There is no way it will leave the ground.”heredity cartoon

Robert Buxbaum, November 2i, 2018.  And one last. I used to teach at Michigan State University. They are fine students.

Of God and gauge blocks

Most scientists are religious on some level. There’s clear evidence for a big bang, and thus for a God-of-Creation. But the creation event is so distant and huge that no personal God is implied. I’d like to suggest that the God of creation is close by and as a beginning to this, I’d like to discus Johansson gauge blocks, the standard tool used to measure machine parts accurately.

jo4

A pair of Johansson blocks supporting 100 kg in a 1917 demonstration. This is 33 times atmospheric pressure, about 470 psi.

Lets say you’re making a complicated piece of commercial machinery, a car engine for example. Generally you’ll need to make many parts in several different shops using several different machines. If you want to be sure the parts will fit together, a representative number of each part must be checked for dimensional accuracy in several places. An accuracy requirement of 0.01 mm is not uncommon. How would you do this? The way it’s been done, at least since the days of Henry Ford, is to mount the parts to a flat surface and use a feeler gauge to compare the heights of the parts to the height of stacks of precisely manufactured gauge blocks. Called Johansson gauge blocks after the inventor and original manufacturer, Henrik Johansson, the blocks are typically made of steel, 1.35″ wide by .35″ thick (0.47 in2 surface), and of various heights. Different height blocks can be stacked to produce any desired height in multiples of 0.01 mm. To give accuracy to the measurements, the blocks must be manufactured flat to within 1/10000 of a millimeter. This is 0.1µ, or about 1/5 the wavelength of visible light. At this degree of flatness an amazing thing is seen to happen: Jo blocks stick together when stacked with a force of 100 kg (220 pounds) or more, an effect called, “wringing.” See picture at right from a 1917 advertising demonstration.

This 220 lbs of force measured in the picture suggests an invisible pressure of 470 psi at least that holds the blocks together (220 lbs/0.47 in2 = 470 psi). This is 32 times the pressure of the atmosphere. It is independent of air, or temperature, or the metal used to make the blocks. Since pressure times volume equals energy, and this pressure can be thought of as a vacuum energy density arising “out of the nothingness.” We find that each cubic foot of space between the blocks contains, 470 foot-lbs of energy. This is the equivalent of 0.9 kWh per cubic meter, energy you can not see, but you can feel. That is a lot of energy in the nothingness, but the energy (and the pressure) get larger the flatter you make the surfaces, or the closer together you bring them together. This is an odd observation since, generally get more dense the smaller you divide them. Clean metal surfaces that are flat enough will weld together without the need for heat, a trick we have used in the manufacture of purifiers.

A standard way to think of quantum scattering is that the particle is scattered by invisible bits of light (virtual photons), the wavy lines. In this view, the force that pushes two flat surfaces together is from a slight deficiency in the amount of invisible light in the small space between them.

A standard way to think of quantum scattering of an atom (solid line) is that it is scattered by invisible bits of light, virtual photons (the wavy lines). In this view, the force that pushes two blocks together comes from a slight deficiency in the number of virtual photons in the small space between the blocks.

The empty space between two flat surfaces also has the power to scatter light or atoms that pass between them. This scattering is seen even in vacuum at zero degrees Kelvin, absolute zero. Somehow the light or atoms picks up energy, “out of the nothingness,” and shoots up or down. It’s a “quantum effect,” and after a while physics students forget how odd it is for energy to come out of nothing. Not only do students stop wondering about where the energy comes from, they stop wondering why it is that the scattering energy gets bigger the closer you bring the surfaces. With Johansson block sticking and with quantum scattering, the energy density gets higher the closer the surface, and this is accepted as normal, just Heisenberg’s uncertainly in two contexts. You can calculate the force from the zero-point energy of vacuum, but you must add a relativistic wrinkle: the distance between two surfaces shrinks the faster you move according to relativity, but measurable force should not. A calculation of the force that includes both quantum mechanics and relativity was derived by Hendrik Casimir:

Energy per volume = P = F/A = πhc/ 480 L4,

where P is pressure, F is force, A is area, h is plank’s quantum constant, 6.63×10⁻³⁴ Js, c is the speed of light, 3×10⁸ m/s, and L is the distance between the plates, m. Experiments have been found to match the above prediction to within 2%, experimental error, but the energy density this implies is huge, especially when L is small, the equation must apply down to plank lengths, 1.6×10⁻³⁵ m. Even at the size of an atom, 1×10⁻¹⁰m, the amount of the energy you can see is 3.6 GWhr/m3, 3.6 Giga Watts. 3.6 GigaWatt hrs is one hour’s energy output of three to four large nuclear plants. We see only a tiny portion of the Plank-length vacuum energy when we stick Johansson gauge blocks together, but the rest is there, near invisible, in every bit of empty space. The implication of this enormous energy remains baffling in any analysis. I see it as an indication that God is everywhere, exceedingly powerful, filling the universe, and holding everything together. Take a look, and come to your own conclusions.

As a homiletic, it seems to me that God likes friendship, but does not desire shaman, folks to stand between man and Him. Why do I say that? The huge force-energy between plates brings them together, but scatters anything that goes between. And now you know something about nothing.

Robert Buxbaum, November 7, 2018. Physics references: H. B. G. Casimir and D. Polder. The Influence of Retardation on the London-van der Waals Forces. Phys. Rev. 73, 360 (1948).
S. Lamoreaux, Phys. Rev. Lett. 78, 5 (1996).